by Biostatsquid | Nov 15, 2025 | Learning, RNAseq, scRNAseq, scRNAseq, Tutorials
MSigDB gene sets: easy msigdbr in R MSigDB gene sets: easy msigdbr in R Welcome to this comprehensive guide on MSigDB (Molecular Signatures Database) and the msigdbr R package! If you’ve ever wondered which gene sets to use for your pathway enrichment analysis, or...
by Biostatsquid | Nov 6, 2025 | Learning, RNAseq, Statistics
How to interpret MA plots How to interpret MA plots In this blogpost, we will go over the basics of an MA plot which is a very useful visualisation for genomics and transcriptomics data. We will go over the basics of MA plots and how to interpret them. This is the...
by Biostatsquid | Jul 15, 2025 | RNAseq, scRNAseq, Tutorials, Uncategorized
Hey! You’re looking at an old post. Newer version here: clusterProfiler tutorial in R R TUTORIAL: Perform pathway enrichment analysis with clusterProfiler() in R Table of contents 5 Before you start 5 Step-by-step clusterProfiler tutorial 9 Step 0: Set up your...

by Biostatsquid | Apr 27, 2025 | Learning, RNAseq, scRNAseq
Understanding the structure of Seurat objects version 5 – step-by-step simple explanation! If you’ve worked with single-cell RNAseq data, you’ve probably heard about Seurat. In this blogpost, we’ll cover the the Seurat object structure,in...
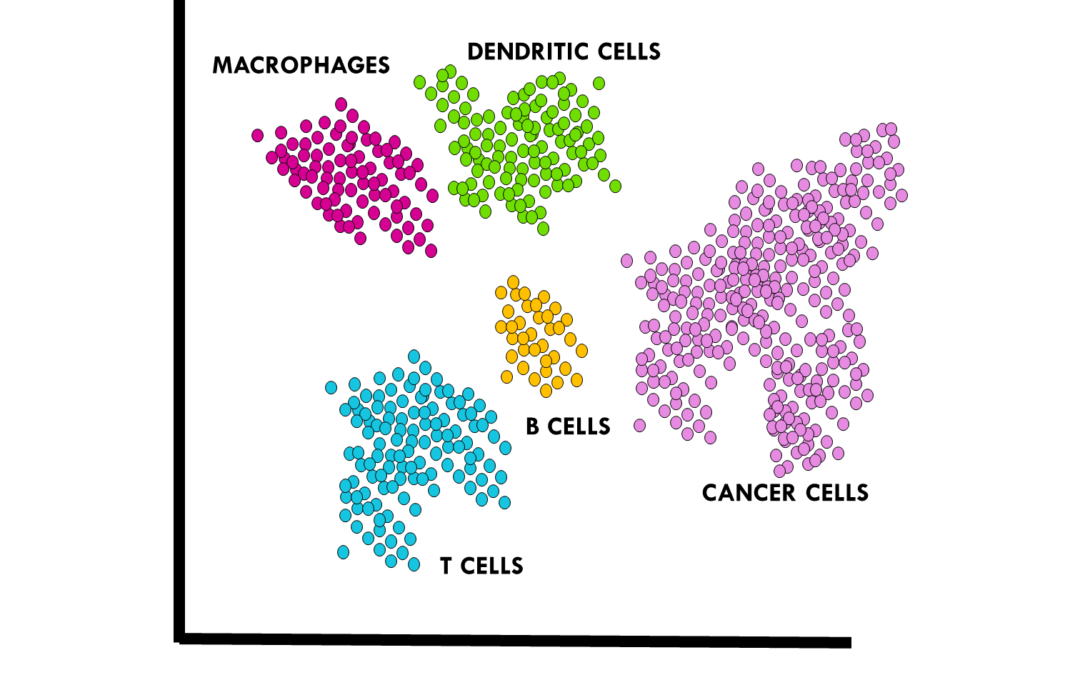
by Biostatsquid | Mar 6, 2025 | Learning, Machine learning, RNAseq, scRNAseq, Statistics
A short but simple explanation of t-SNE – easily explained with an example! PCA, t-SNE, UMAP… you’ve probably heard about all these dimensionality reduction methods. In this series of blogposts, we’ll cover the similarities and differences...
by Biostatsquid | Apr 13, 2023 | Learning, RNAseq
Top tips and resources to perform cell type annotation on scRNAseq data Once you preprocess your single-cell RNA sequencing (scRNAseq) data, it is time for one of the biggest challenges in a standard scRNAseq pipeline: annotating cell types. The scientific community...

 This work is licensed under
CC BY-NC-SA 4.0
.
This work is licensed under
CC BY-NC-SA 4.0
.