by Biostatsquid | Jul 22, 2026 | Learning, Machine learning, Statistics
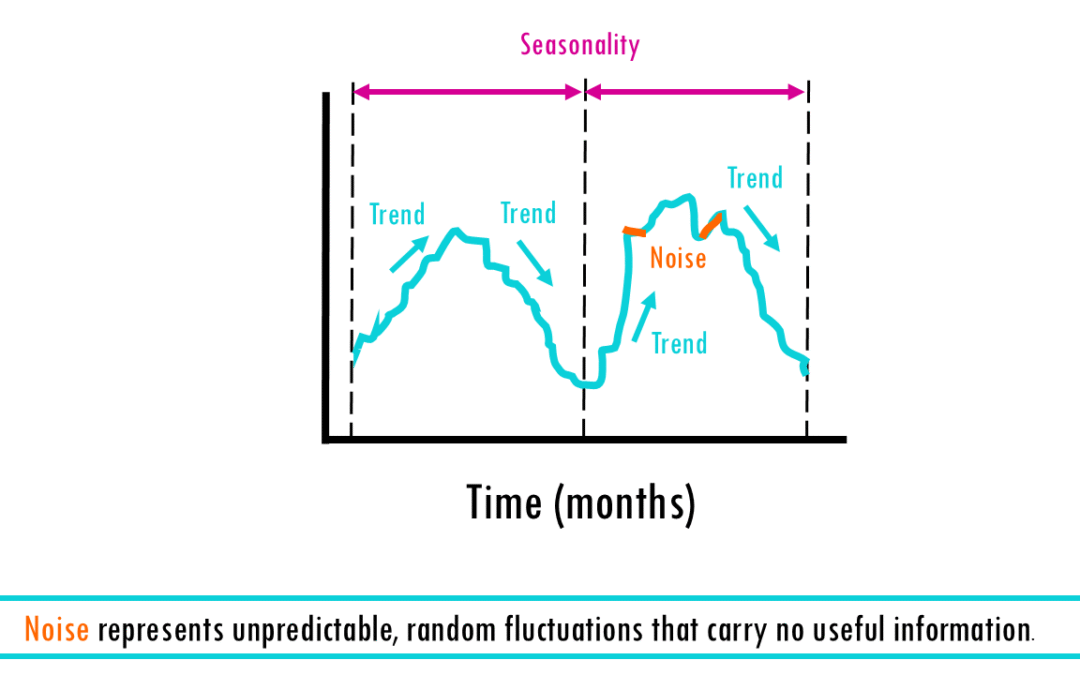
Introduction to time series forecasting From predicting a crash in the stock market, to estimating the temperature and wether you’ll need an umbrella tomorrow – time series analysis is everywhere! In this blogpost, we’ll cover what a time series is, why...
by Biostatsquid | Apr 9, 2026 | Learning, Machine learning, Statistics
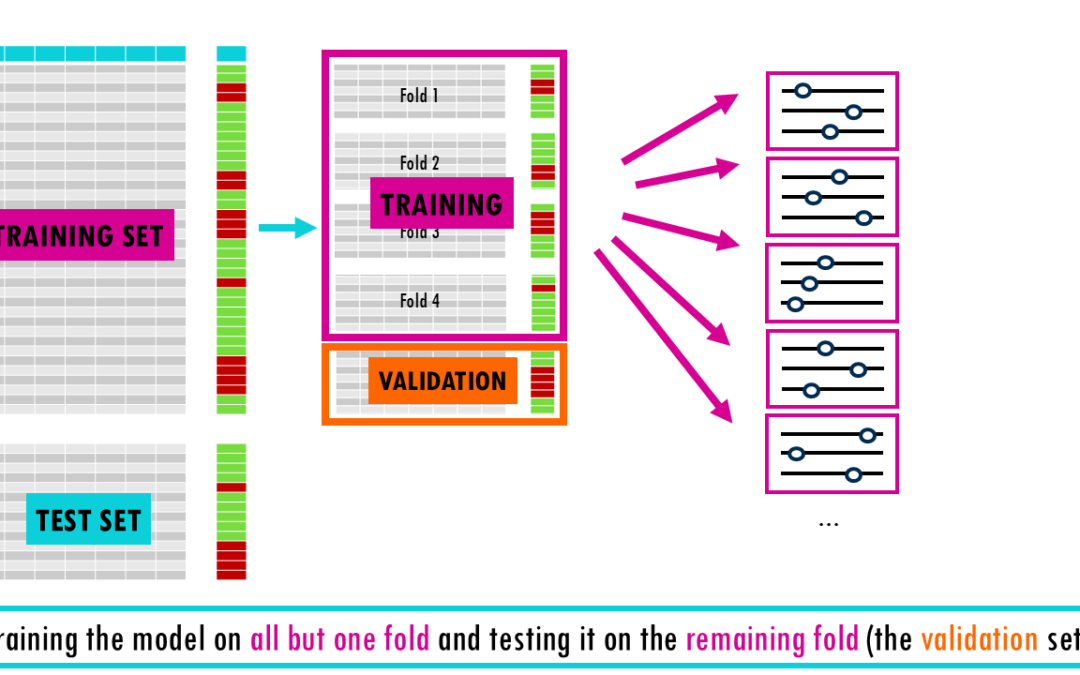
From a simple train-test split to stratified nested cross-validation! Imagine studying for a final exam by memorizing the exact answers to a practice test. You might feel like a genius while grading yourself, but if the actual exam asks the same questions in a...
by Biostatsquid | Feb 21, 2026 | Learning, Statistics
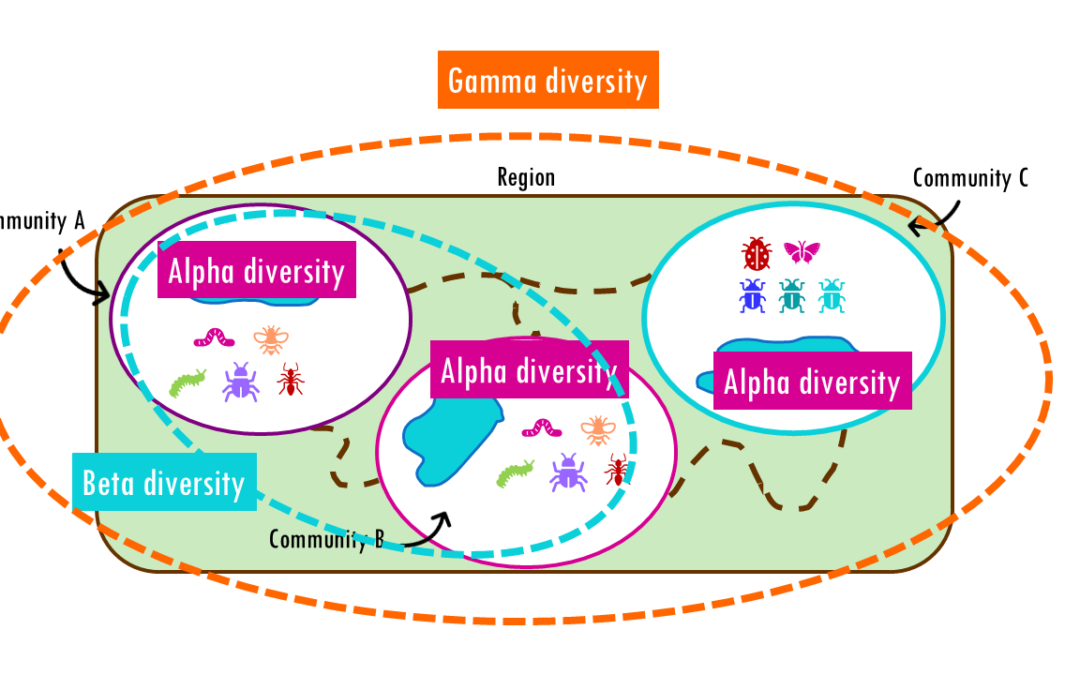
How different are communities from each other? Beta diversity easily explained! If you’ve ever hiked from a dense forest into an open grassland, you’ve probably noticed how dramatically the plants, insects, and animals can change within just a few miles. This...
by Biostatsquid | Feb 14, 2026 | Learning, Statistics
Exploring Hill numbers to compare the diversity across communities Whether you are analyzing a rainforest ecosystem, a human gut microbiome, or a B-cell receptor (BCR) repertoire, the fundamental challenge is the same: How do we accurately measure the diversity within...
by Biostatsquid | Feb 14, 2026 | Learning, Statistics
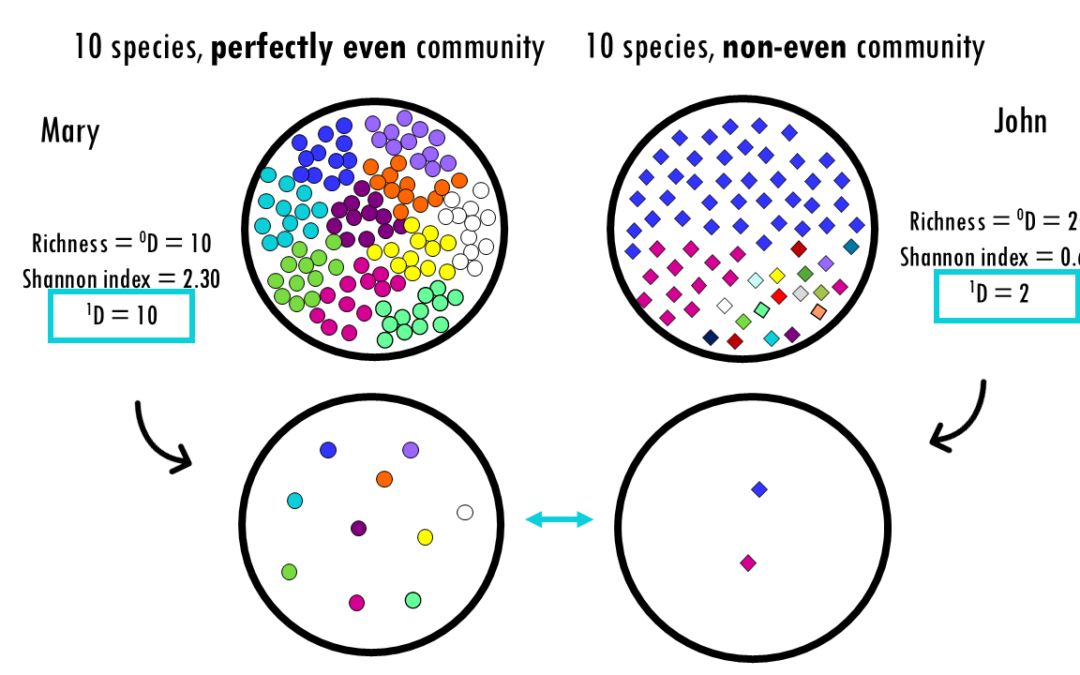
Exploring alpha diversity indices and how to interpret them: Shannon, Simpson, Gini, Chao1 and more! Whether you are analyzing a rainforest ecosystem, a human gut microbiome, or a B-cell receptor (BCR) repertoire, the fundamental challenge is the same: How do we...
by Biostatsquid | Nov 6, 2025 | Learning, RNAseq, Statistics
How to interpret MA plots How to interpret MA plots In this blogpost, we will go over the basics of an MA plot which is a very useful visualisation for genomics and transcriptomics data. We will go over the basics of MA plots and how to interpret them. This is the...

 This work is licensed under
CC BY-NC-SA 4.0
.
This work is licensed under
CC BY-NC-SA 4.0
.