by Biostatsquid | Jul 22, 2026 | Learning, Machine learning, Statistics
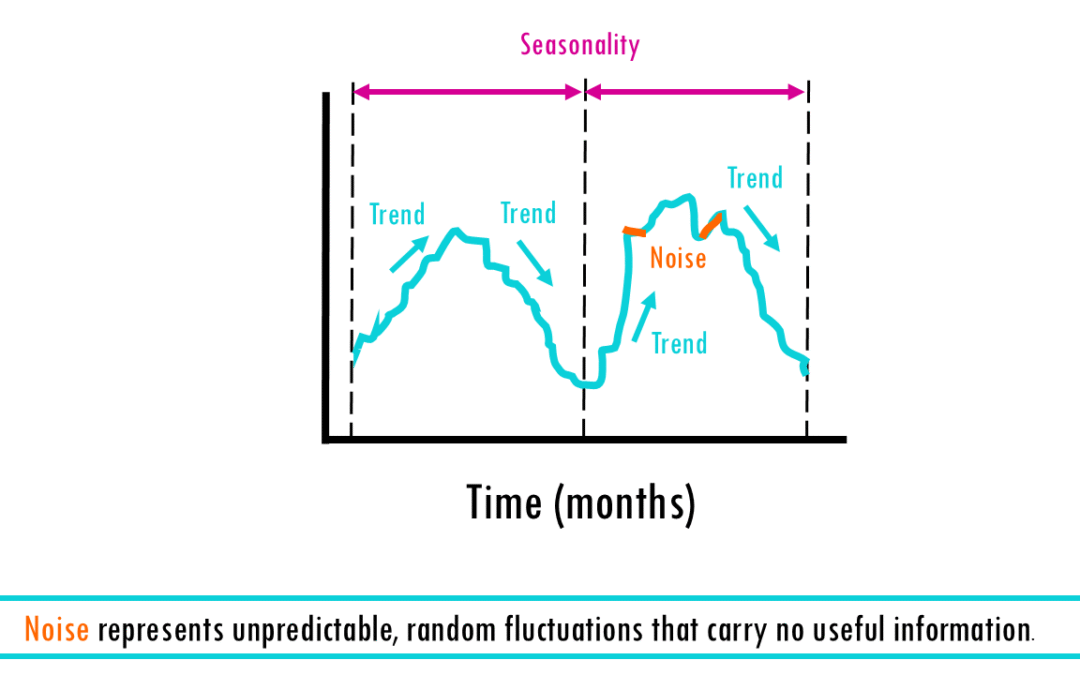
Introduction to time series forecasting From predicting a crash in the stock market, to estimating the temperature and wether you’ll need an umbrella tomorrow – time series analysis is everywhere! In this blogpost, we’ll cover what a time series is, why...
by Biostatsquid | Apr 9, 2026 | Learning, Machine learning, Statistics
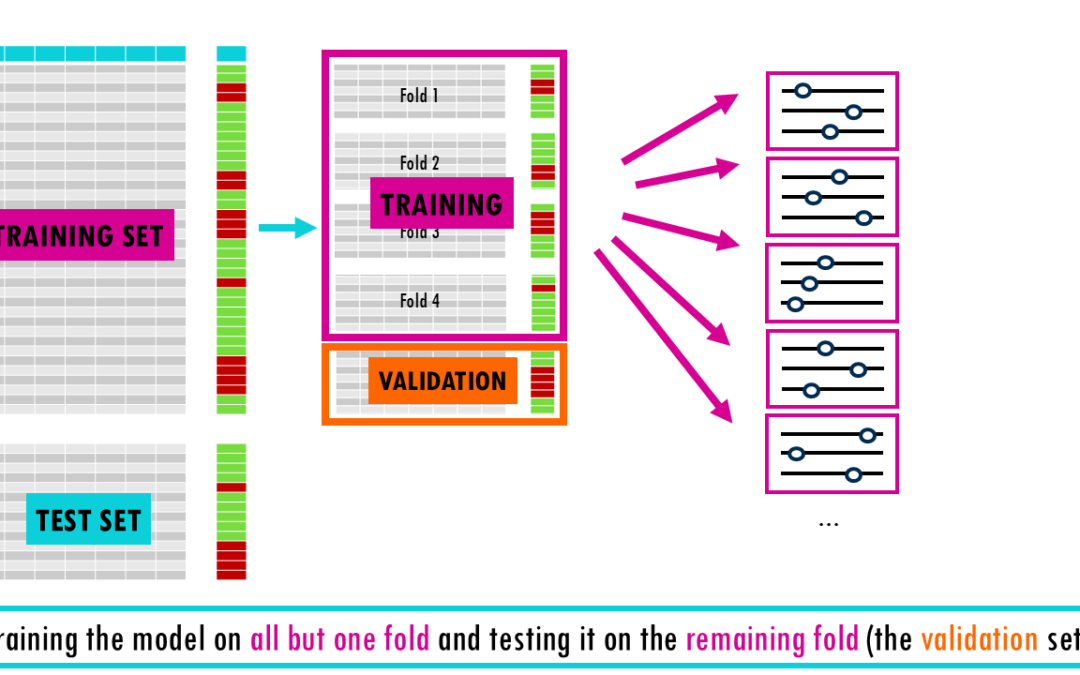
From a simple train-test split to stratified nested cross-validation! Imagine studying for a final exam by memorizing the exact answers to a practice test. You might feel like a genius while grading yourself, but if the actual exam asks the same questions in a...
by Biostatsquid | Mar 6, 2025 | Learning, Machine learning, RNAseq, scRNAseq, Statistics
A short but simple explanation of t-SNE – easily explained with an example! PCA, t-SNE, UMAP… you’ve probably heard about all these dimensionality reduction methods. In this series of blogposts, we’ll cover the similarities and differences...
by Biostatsquid | Feb 28, 2025 | Machine learning, scRNAseq, Statistics
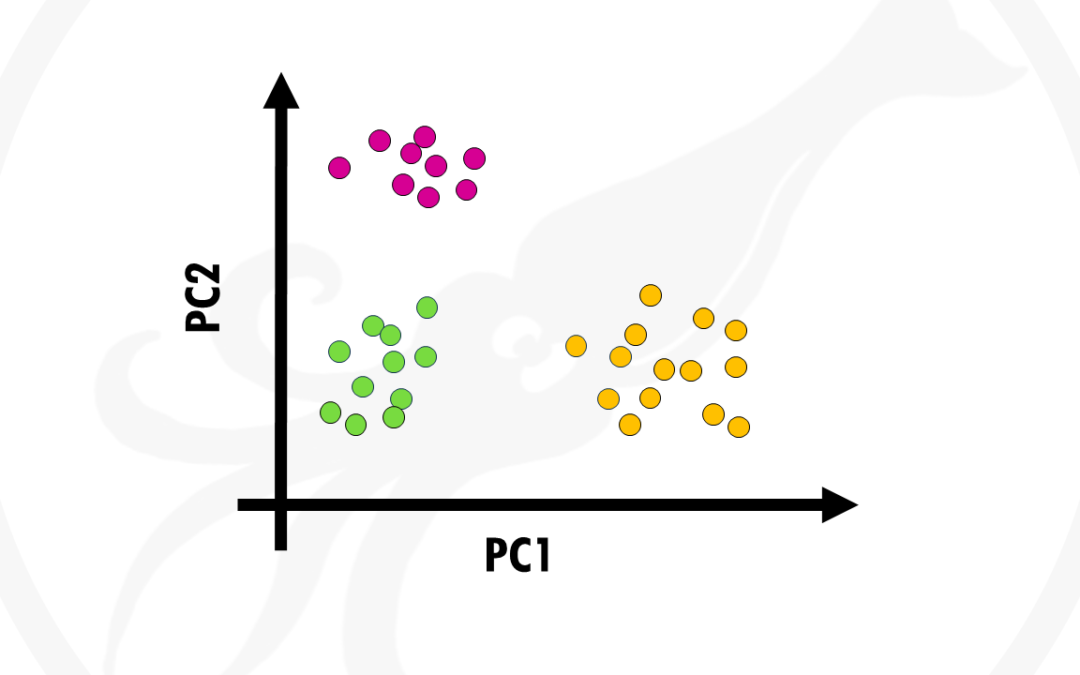
A short but simple explanation of PCA – easily explained with an example! PCA, t-SNE, UMAP… you’ve probably heard about all these dimensionality reduction methods. In this series of blogposts, we’ll cover the similarities and differences...
by Biostatsquid | Apr 2, 2024 | Learning, Machine learning, Statistics
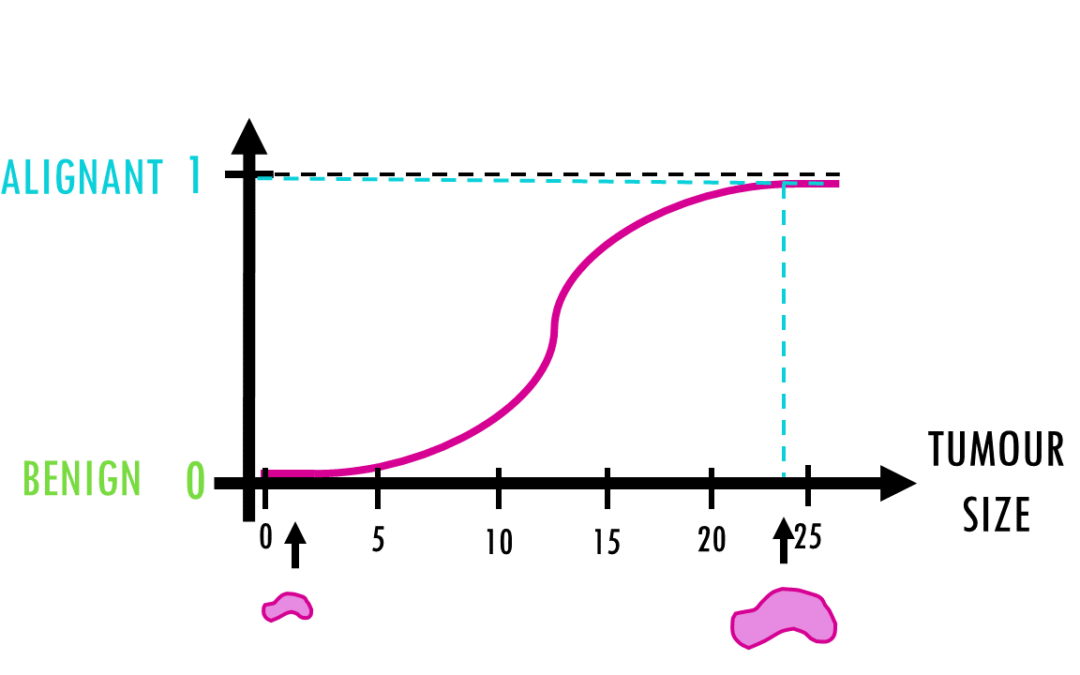
A short but simple explanation of logistic regression – easily explained with an example! Logistic regression is a statistical model (also known as logit model) which is often used for classification and predictive analytics. But what is logistic regression?...
by Biostatsquid | Nov 12, 2022 | Learning, Machine learning, Statistics
In this post I will try to give you a simple and practical explanation on what is Principal Component Analysis and how to use it to visualise your biological data. Principal Component Analysis, or PCA, is a widely used technique to visualise multidimensional datasets....

 This work is licensed under
CC BY-NC-SA 4.0
.
This work is licensed under
CC BY-NC-SA 4.0
.