
BiostatCODE
Hands-on coding tutorials with biological data
If you would like to…
- learn data wrangling and visualisation tools for biological data
- start learning code with easy step-by-step guides
- improve your coding skills with R or Python
- learn by doing with hands-on tutorials
Check out Biostatsquid's Youtube videos and tutorials
Data science and biostatistics coding tutorials
Introduction to tidymodels (logistic regression in R)
Introduction to tidymodels: logistic regression in R Introduction to tidymodels: logistic regression in R A step-by-step tutorial In this blogpost, we will learn how to build a complete logistic regression workflow using the tidymodels framework in R. The goal is to...
MSigDB gene sets: easy msigdbr in R
MSigDB gene sets and how to use msigdbr in R
MA plots with ggplot: easy R tutorial
MA plots with ggplot: easy R tutorial MA plots with ggplot: easy R tutorial In this blogpost, we will learn how to create our own MA plot with ggplot, following an easy step-by-step tutorial in R. If you haven’t yet, check out my other blogpost where I go over the...
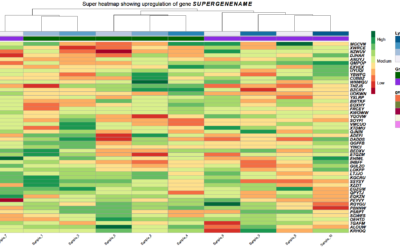
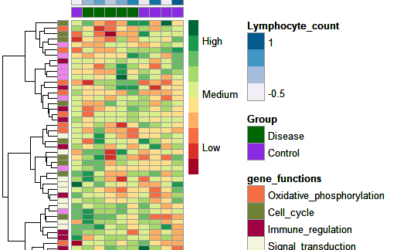
Heatmaps with ComplexHeatmap() R tutorial
ComplexHeatmap Tutorial: create publication-ready heatmaps in R ComplexHeatmap Tutorial: create publication-ready heatmaps in R In this easy step-by-step tutorial we will learn how to create and customise a heatmap with R package ComplexHeatmap. ComplexHeatmap is one...
Pathway Enrichment Analysis with clusterProfiler (old version)
Hey! You're looking at an old post. Newer version here: clusterProfiler tutorial in RR TUTORIAL: Perform pathway enrichment analysis with clusterProfiler() in RBefore you start...Welcome to Biostatsquid's easy and step-by-step tutorial on ClusterProfiler! In this...
Easy gene set enrichment analysis with fgsea (old version)
Hey! You're looking at an old post. Newer version here: fgsea tutorial in RA step-by-step R tutorial on performing Gene Set Enrichment Analysis with R package fgseaIn this tutorial you will learn how to conduct Gene Set Enrichment Analysis (GSEA) using R-package...
Comparing multiple groups: Kruskal-Wallis test in R
Easy explanation and R tutorial of the Kruskal-Wallis test to compare medians across three or more independent groups when normality assumptions aren’t met.
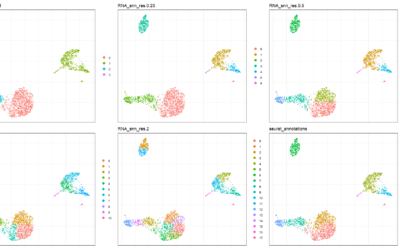
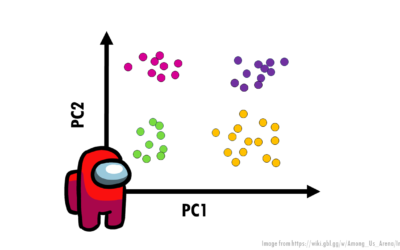
Introduction to single-cell analysis with Seurat v5
Explore the power of single-cell RNA-seq analysis with Seurat v5 in this hands-on tutorial, guiding you through data preprocessing, clustering, and visualization in R.
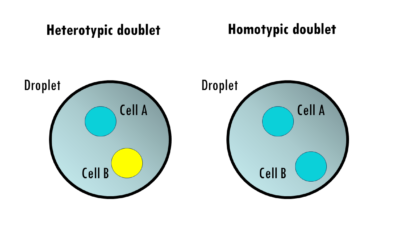
How to remove doublets from scRNAseq data
Follow this easy, step-by-step tutorial in R to remove doublets from scRNAseq data.
Easy DoubletFinder tutorial in R
An easy DoubletFinder tutorial in R,with a step-by-step explanation on how to detect doublets in your single-cell RNAseq dataset.
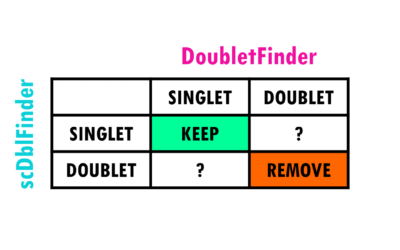
Easy scDblFinder tutorial: doublet detection in R
scDblFinder tutorial – detect and remove doublets with scDblFinder package in R
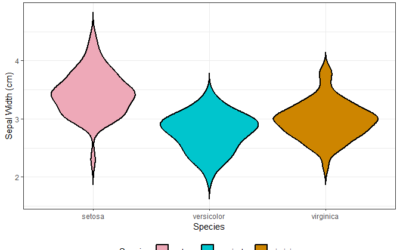
Easy violin plots tutorial in R with ggplot2
In this tutorial we will learn how to create and customise our own violin plots in R with ggplot2. We will also create our own custom function!
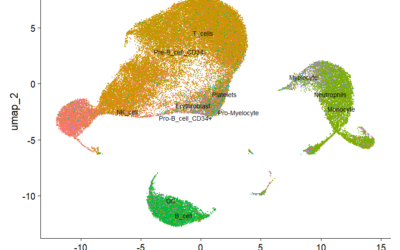
SingleR tutorial: easy cell type annotation
In this easy, step-by-step SingleR tutorial you will learn how to do cell type annotation using SingleR, a reference-based cell type annotation tool.
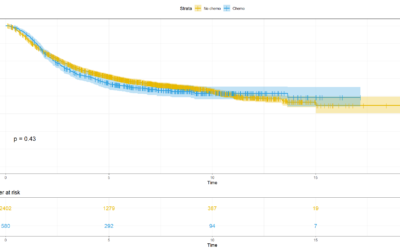
Easy survival analysis in R
In this easy survival analysis in R tutorial, we’ll learn how to plot a Kaplan Meier curve, test for differences in survival between groups with log rank test and Cox regression!
How to use italics in plots in R: easy tutorial
In this post, you will learn a few ways to use italics in plots in R, using bquote() and as.expression(). You can also make text and titles bold, italics and more!
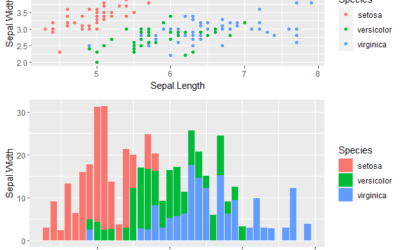
Top visualisation tricks you should know in R
Top visualisation tricks and tips to create pretty and publication-ready plots in R!
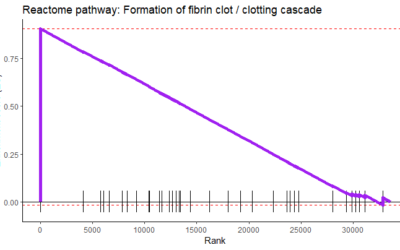
Easy Gene Set Enrichment Analysis in R with fgsea()
In this step by step tutorial, you will learn how to perform easy gene set enrichment analysis in R with fgsea() package.
Pathway Enrichment Analysis with clusterProfiler
Step by step tutorial to carry out pathway enrichment analysis with R package clusterProfiler. From differentially expressed genes to pathways!
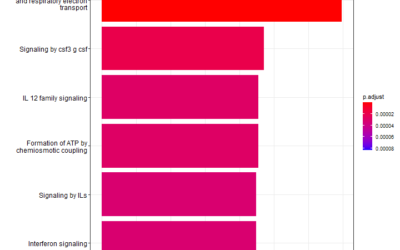
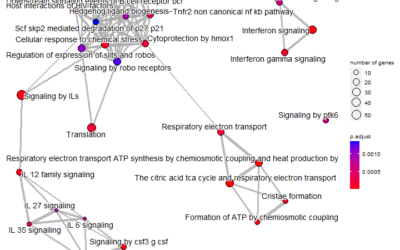
Easy R tutorial: pathway enrichment analysis plots
Follow this step-by-step easy R tutorial to visualise your results with these pathway enrichment analysis plots. From barplots to enrichment maps!
Step-by-step heatmap tutorial with pheatmap()
Follow this easy, step-by-step heatmap tutorial with pheatmap() to create and customize your own heatmaps in R
Can’t find a specific blogpost?
Try using the search bar below or write to me if you have a suggestion for a new topic!