A short but simple explanation of logistic regression – easily explained with an example!
Logistic regression is a statistical model (also known as logit model) which is often used for classification and predictive analytics.
But what is logistic regression? When do we use it?
In this post, you will find out:
- what is Logistic regression
- how to interpret the results logistic regression
- what is the ‘decision boundary’
- simple vs multiple logistic regression
- how to interpret logistic regression coefficients with an example
… easily explained!
So if you are ready… let’s dive in!
Click on the video to follow my easy Logistic Regression explanation with an example on Youtube!
What is Logistic Regression?
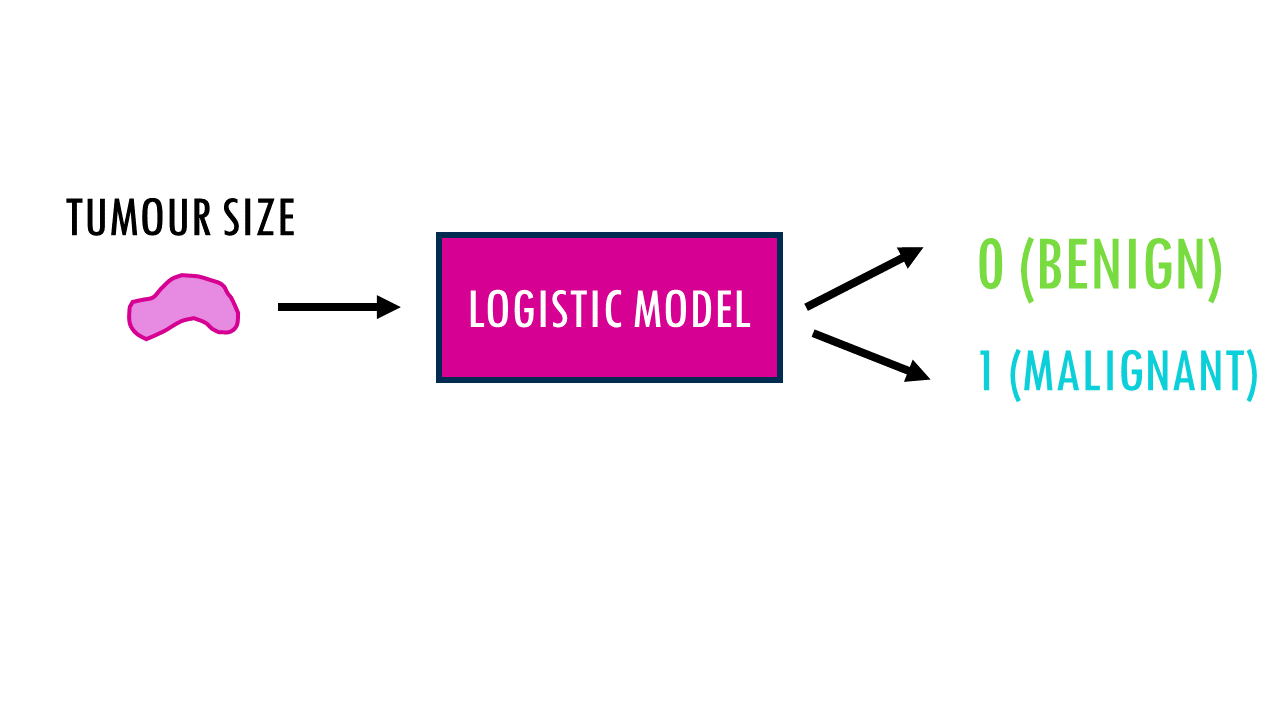
Imagine we have the size of different tumours in mm3, and we want to figure out whether the tumour is malignant or benign based on size.
In summary, we want a math equation where we input the predictor variable, size, and it tells us whether the tumour is malignant or benign.
Since we’re talking about mathematical equations, we need to encode the outcome as a digit, since the result will be a numerical value. So let’s assign 0 to benign and 1 to malignant. Now the actual equation will be such that given a tumour size, we will get a number between 0 (benign) and 1 (malignant).

This equation, or model we’re looking for, is the logistic regression model. It’s basically used when we the outcome we want to predict is binary, two values: 0 and 1.
There are many examples and uses of logistic regression. For example, you can use logistic regression:
- classify emails as either spam or non-spam based on the presence of certain keywords
- predict whether a woman is pregnant or not based on the hormone hCG levels in urine
- predict if a student will pass or not the exam based on the hours of study
- … and much more!
Can you see the pattern? In all cases, we are using a numerical variable (hours of study, hormone concentration, number of ‘spammy’ keywords…) to classify something into 2 classes: 0 or 1.
Squidtip
Logistic regression is a statistical method used for binary classification tasks, where the outcome variable is categorical with two possible values, such as “yes” or “no”, “spam” or “not spam”, “fraudulent” or “not fraudulent”.
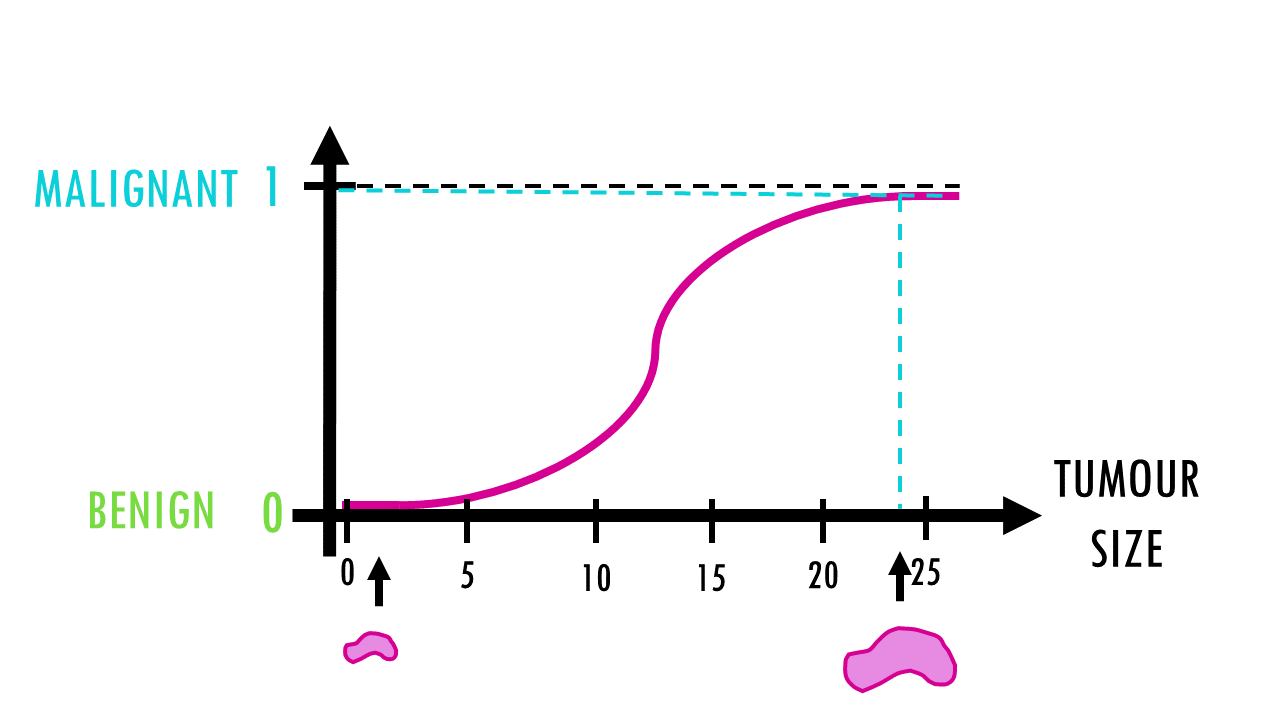
Logistic regression is based on the you guessed it, logistic function, which looks like an S-shaped curve like this one that maps any real-valued number into a value between 0 and 1.
The logistic function will convert any tumour size into a number between 0 (benign) and 1 (malignant).

So for example, if the tumour size is 1, the predicted value is 0 – the tumour is benign. If the tumour size is 24, the tumour is malignant.

But wait a minute. If 0 is malignant and 1 is benign, what does An intermediate result of 0.4 or 0.8 mean?
This is the key about logistic regression – it’s basically giving you the probability that the tumour is benign, or malignant.
The closer to 0, the more probable the tumour is benign, the closer to 1, the more likely the tumour is malignant.
So if we have a size of 10, the probability of the tumour being malignant is 0.35. So it’s probably benign according to our model at least.
In a way, logistic regression converts a predictor variable into a probability of something happening, or not happening.
Squidtip
The logistic model predicts the probability of a sample belonging to a particular class.
Simple vs multiple logistic regression
If you have read my other post on Cox regression analysis, you probably already guesses this. You have simple or multiple logistic regression, depending on if you have one predictive variable or more. Easy!
For example, we might want to improve our ability to predict malignancy of a tumour by adding the expression level of TP53, an oncogene, in our model.
We would build a model using the tumour size and TP53 biomarker expression levels as predictors. The model will estimate the probability of a tumor being malignant based on these features.
This is an example with two features, but often logistic regression models include hundreds of features!
Squidtip
Note that more features not always mean a better model. This has to do with the explanatory power of the features, and if certain features are correlated.
For example, if we added the number of dogs the patient owns to our model, it would most likely not have an impact on the predictive power of our model, since the number of pets you have cannot be used to predict if a tumour is malignant or not. If we added the weight of the tumour, it would probably not improve the model by a lot, since weight and volume are highly correlated features.

How to interpret the results of a logistic regression model
We’d like to build a logistic model using the tumour size and TP53 biomarker expression levels as predictors. The model will estimate the probability of a tumor being malignant based on these features.
To build a logistic regression model, we need data. In particular we need the sizes and TP53 status of many tumours AND also if they are benign or not. That way, our model can learn from our data. It will assign coefficients to our predictors, based on its learning.
The coefficients for each predictor tell us the impact of that predictor on the likelihood or probability that the tumour is malignant.
For example, a positive coefficient for tumor size suggests that larger tumors are more likely to be malignant, while a negative coefficient for the biomarker expression level suggests that higher expression levels might be associated with lower malignancy probability.
Once the logistic regression model is trained, it can be used to predict the malignancy status of new tumors based on their size and biomarker expression levels. The model outputs a probability score, for example, 0.38, so we decide that the tumour is benign.

Decision boundary in logistic regression
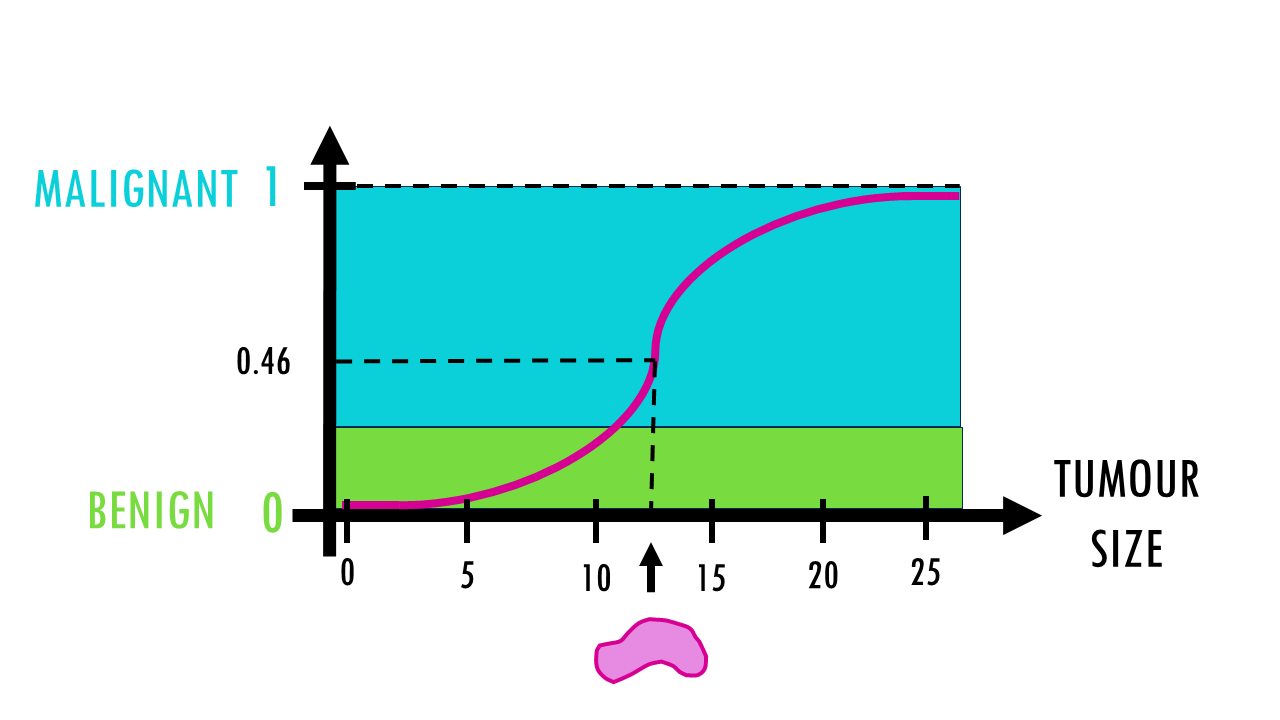
Our model just gives us the probability of malignancy, but we decide the threshold we use to classify a tumour as malignant or benign. This is the decision boundary, the point we use to separate the two classes (benign/malignant).
Usually, the default is 0.5 – so if the probability of a given tumour is higher than 0.5, we classify it as malignant, if it’s lower, it’s benign. But in many cases we want a different decision boundary, higher, or lower than 0.5. For example, this malignant tumour has a probability of 0.46 – with a decision threshold of 0.5, we should classify it as benign, but this is very near 0.5. To make sure we don’t misclassify malignant tumours as benign, we might lower the threshold to 0.3. Now, we might misclassify some benign tumours as malignant, but there’s less chance of misclassifying a malignant tumour as benign.
Of course, it’s also key to know how good our model actually is, for which we need to look at metrics like accuracy, sensitivity, specificity… but that’s a story for another day.

Final notes on Logistic regression
In summary, with the logistic regression, we use one or more predictive variables to predicr a binary outcome. The goal is to learn a decision boundary that separates the two classes as accurately as possible. The model predicts the probability of a sample belonging to a particular class, and a threshold can be applied to these probabilities to make binary predictions.
If you’d like to see a tutorial on how to do logistic regression analysis in R, leave me a comment below!
Want to know more?
Additional resources
If you would like to know more about common survival time analysis, check out:
You might be interested in…
- Survival time analysis: easily explained!
- Kaplan-Meier curves easily explained
- Log rank test – easily explained!
Ending notes
Wohoo! You made it ’til the end!
In this post, I shared some insights on logistic regression.
Hopefully you found some of my notes and resources useful! Don’t hesitate to leave a comment if there is anything unclear, that you would like explained differently/ further, or if you’re looking for more resources on biostatistics! Your feedback is really appreciated and it helps me create more useful content:)
Before you go, you might want to check:
Squidtastic!
You made it till the end! Hope you found this post useful.
If you have any questions, or if there are any more topics you would like to see here, leave me a comment down below.
Otherwise, have a very nice day and… see you in the next one!
Squids don't care much for coffee,
but Laura loves a hot cup in the morning!

If you like my content, you might consider buying me a coffee.
You can also leave a comment or a 'like' in my posts or Youtube channel, knowing that they're helpful really motivates me to keep going:)
Cheers and have a 'squidtastic' day!

0 Comments