
A simple explanation of Cox regression and hazard ratios for survival time analysis
Survival time analysis studies a variable with a start time and an end time, which is when a certain event occurs. The event could be death, but also be relapse after chemotherapy, a tooth falling out or your car breaking down. If you are not familiar with survival time analysis, check out my blogpost on survival time analysis -simply explained first!
As we previously saw, the log rank test is used to test whether there is a difference between the survival times of different groups. For example, we might compare the survival time of a group of patients who received drug A, versus the survival times of patients who received drug B.
But you are probably also interested in other factors that affect that survival. Do men survive longer than women? Does smoking have an influence in survival? What about having high or low blood pressure? Does having a mutation in certain genes increase the odds of surviving longer? What about factors like exercise or diet? The log rank test does not allow other explanatory variables to be taken into account. That is when we need Cox Proportional Hazards Survival Regression.
In this post, you will find out:
- what is Cox regression analysis
- how to interpret the results of Cox regression
- what is a ‘hazard ratio’
- univariate vs multivariate Cox regression
- how to interpret Cox regression results with an example
… easily explained!
Before we start, you might want to check out my previous blogposts for an easy introduction to survival analysis and the Kaplan-Meier curves.
In this post, we will discuss the main concepts behind the Cox regression – easily explained!
So if you are ready… let’s dive in!
Click on the video to follow my easy Cox regression explanation with an example on Youtube!
What is the Cox regression?
Cox regression, also known as the proportional hazards model, is used in survival time analysis to analyze the survival times of individuals or the time until a specific event (e.g., time until death, time until disease recurrence, etc.) occurs. We can use Cox regression to test the difference between survival times of particular groups of patients, while still allowing for other variables that may influence survival time.

In this model, the hazard rate is the probability of the event happening, given you have survived up to a specific point in time.
For example, let’s take the typical example of a clinical trial, where the event of interest (the hazard) is death. The hazard would be the probability of dying given that a patient has survived up to a given point in time, or the risk for death at that moment.

Squidtip
We can assess whether different factors affect survival time with the Cox Regression. In other words, Cox Regression allows us to determine the effects of multiple independent variables on a time-to-event outcome, either to test hypotheses about the independent variables or to build a predictive model.
In Cox regression, you can include covariates (independent variables) that you believe may influence the time-to-event. These covariates can be categorical, discrete or continuous and are used to model how different factors affect the hazard function.

The Cox proportional hazards model assumes that the hazard (i.e., the risk of the event happening at any given time) for any individual is proportional to the hazard for any other individual. In other words, the relative risk of the event is assumed to be constant.

Squidtip
In many cases, not all individuals in the study will experience the event of interest during the study period. Some individuals may be “censored” because they are still alive or have not experienced the event by the end of the study. Cox regression can handle censored data. If you’d like to read more about censoring, check my blogpost on survival time analysis.
What are the outputs of Cox regression?
What do you ‘get’ after performing Cox regression?
- Coefficients
- Hazard ratios
Coefficients
he Cox model mathematically models the hazard function as a function of covariates.
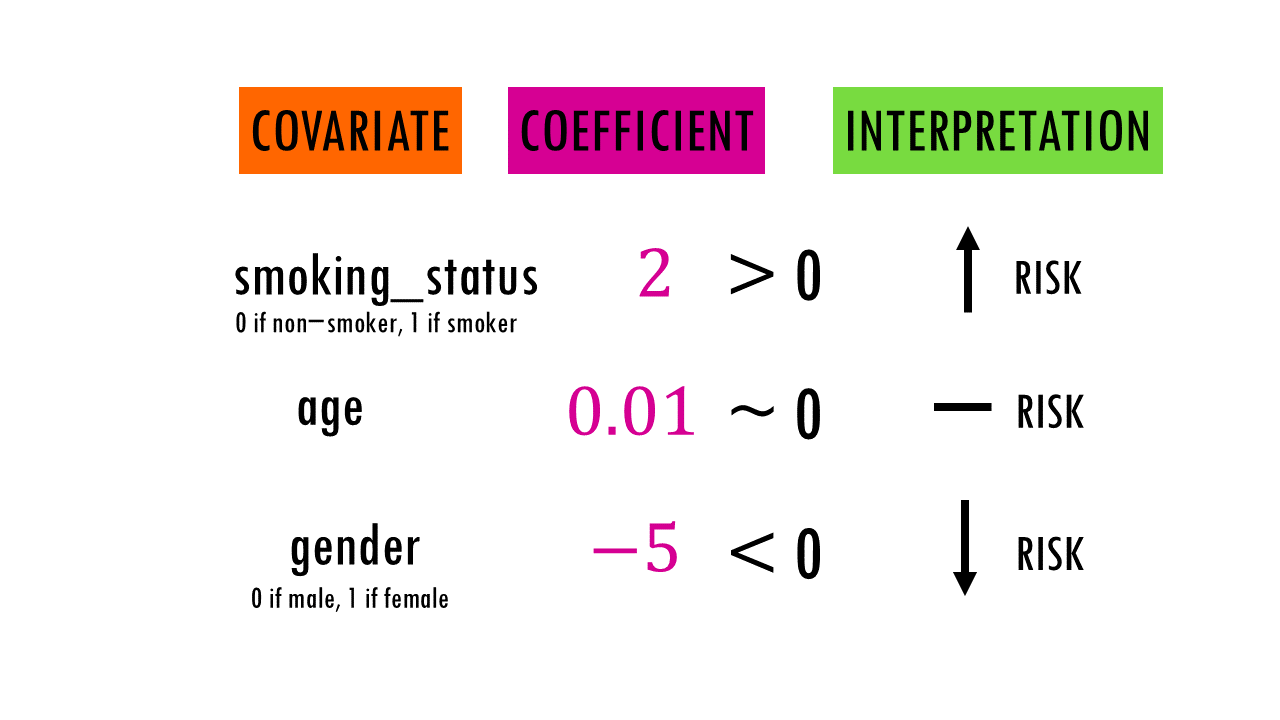
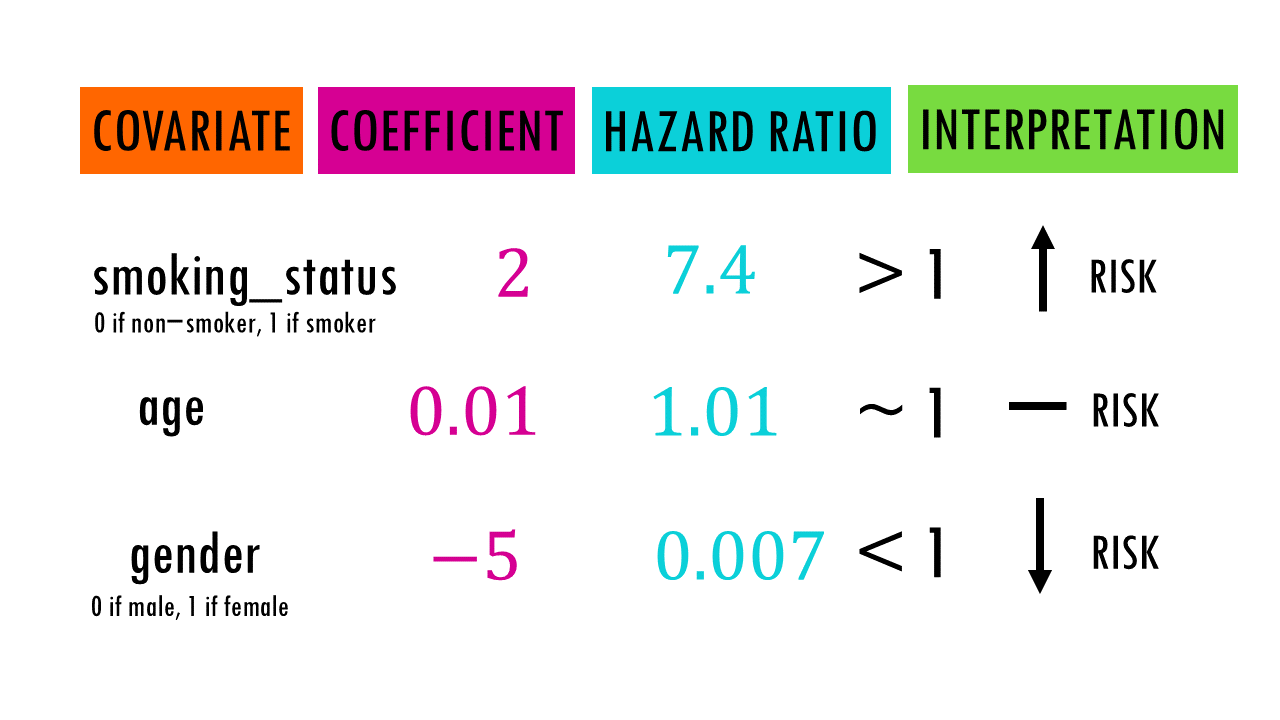
For every covariate, you will get a coefficient. The coefficients (β) indicate the the log hazard ratio associated with a specific covariate, assuming all other covariates remain constant.
- A positive coefficient (β > 0) indicates an increase in the log hazard (higher risk)
- A negative coefficient (β < 0) indicates a decrease in the log hazard (lower risk).
- A coefficient of 0 (β ~ 0) means there is no difference in hazard (same risk), the variable has null or very little effect on survival time.
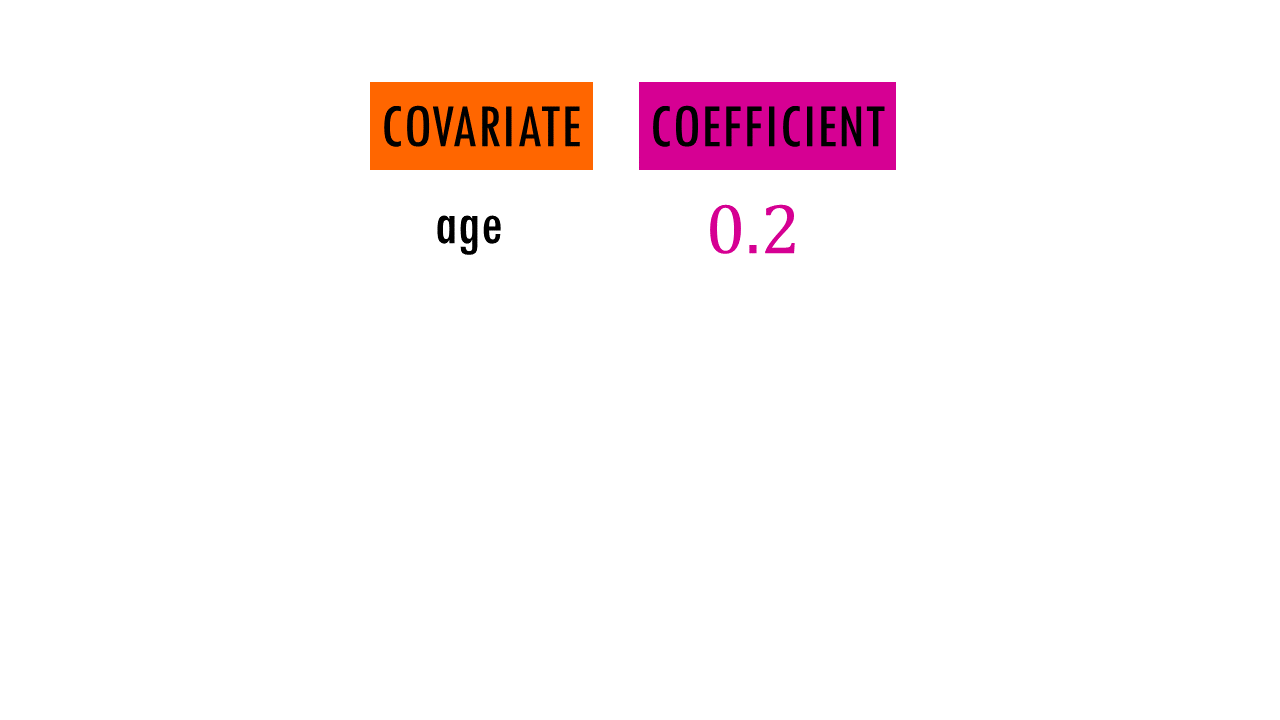
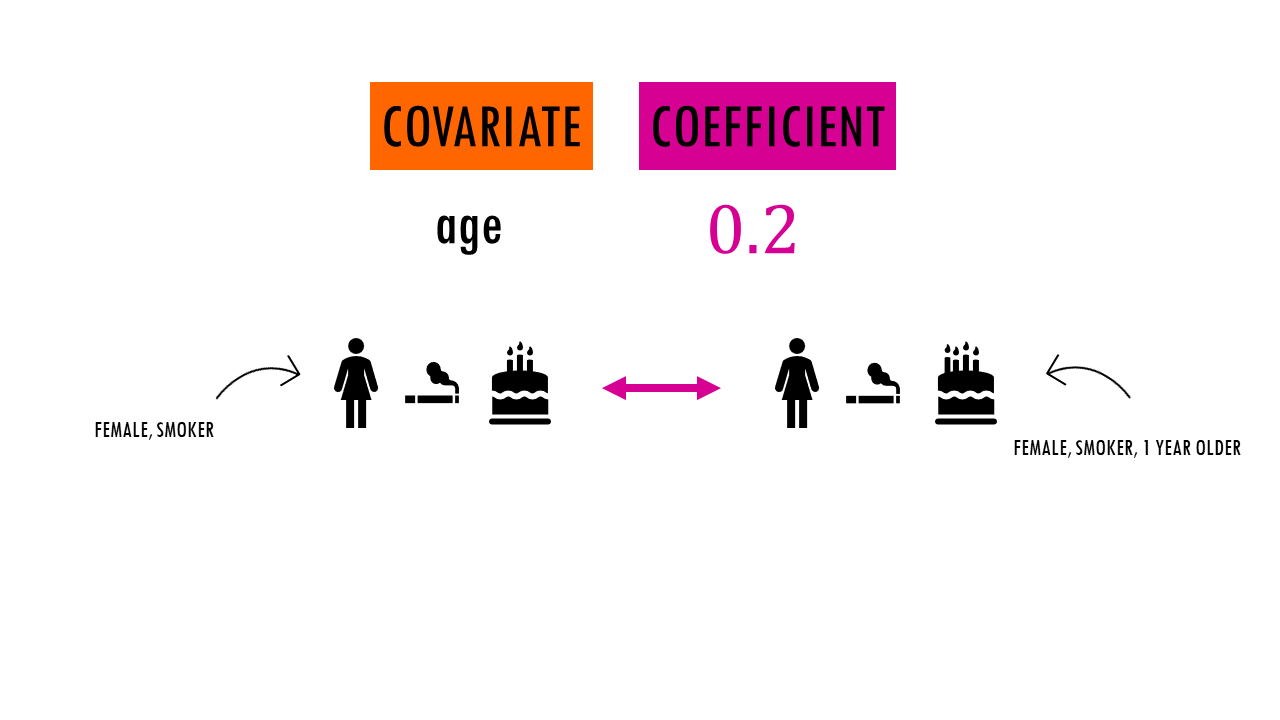
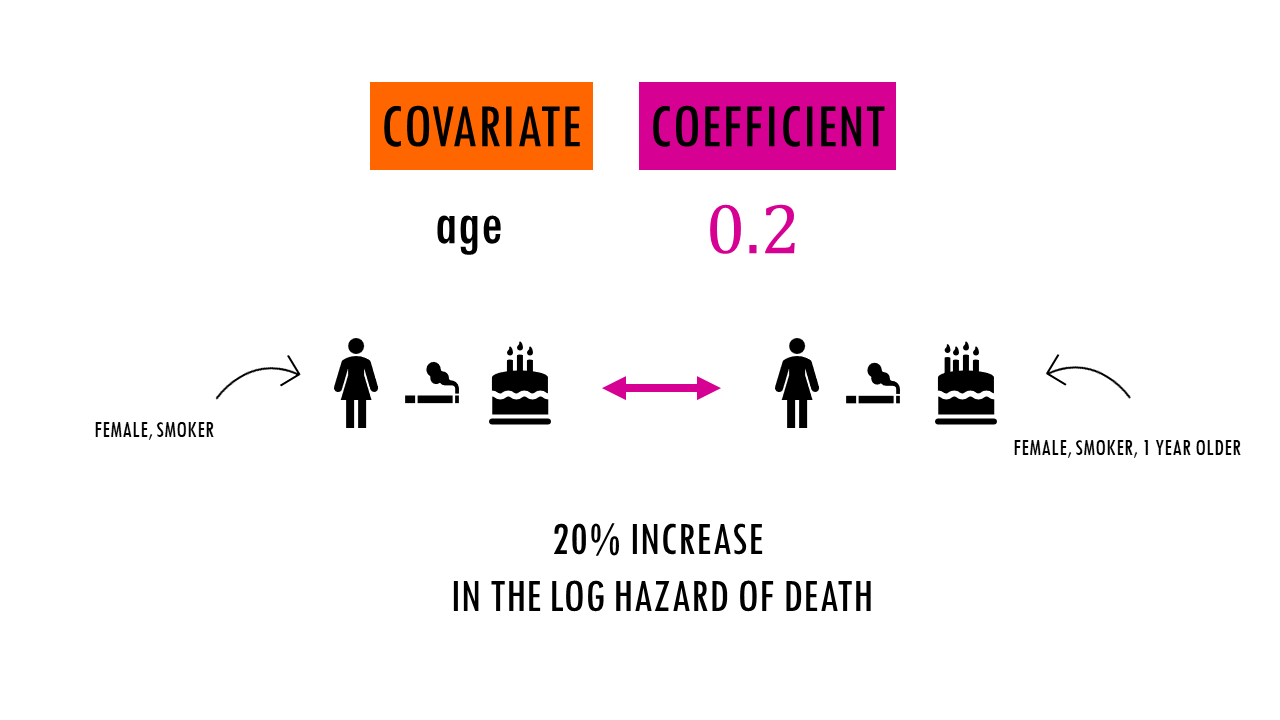
For example, if a covariate (age) has a coefficient of 0.2, it means that a one-unit increase in the covariate (being 1 year older) is associated with a 20% increase in the log hazard of the event.
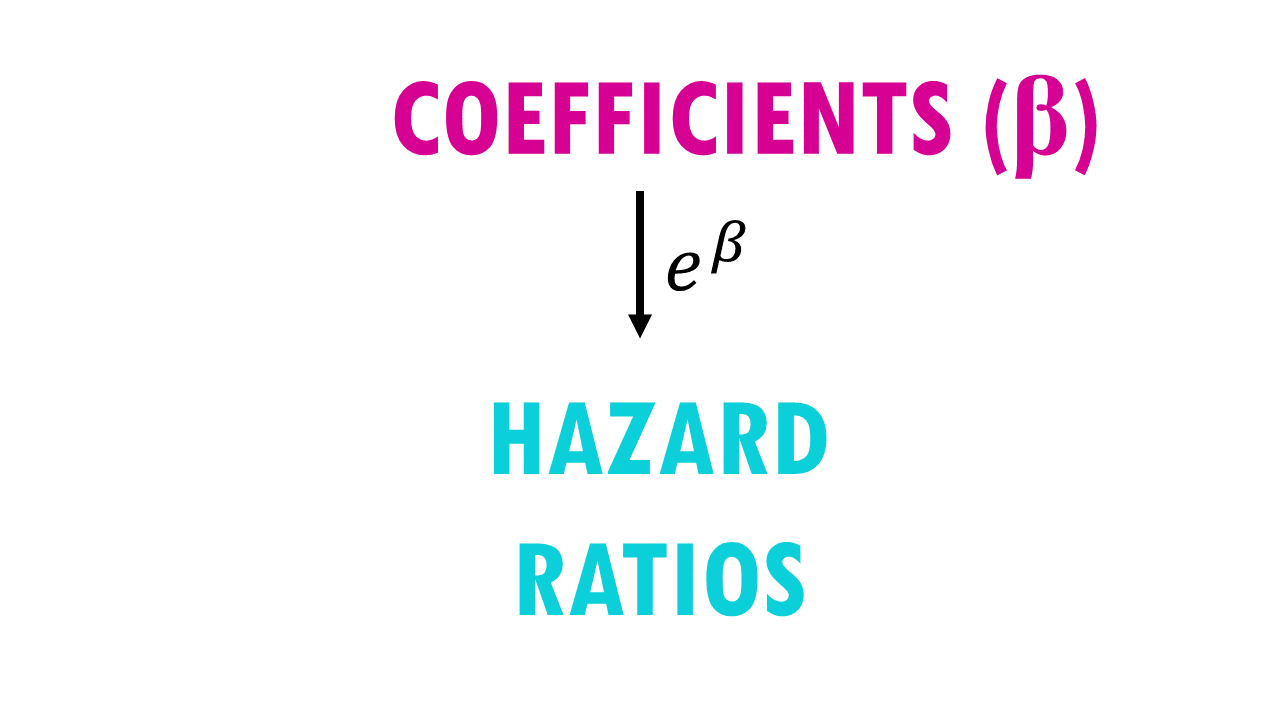
Coefficients are a bit more difficult to interpret because they are in the log hazard scale, meaning they represent a change in the logarithm of the hazard for a one-unit change in the covariate. To make it easier to interpret, we can take the exponential to ‘remove’ the logarithm and get…
Hazard ratios (HR)
The hazard ratio (HR) is the exponentiated form of the coefficient (e^β). It quantifies the relative change in the hazard of the event for a one-unit change in the covariate.
How do we interpret hazard ratios?
- HR > 1 indicates an increased hazard
- HR < 1 indicates a decreased hazard.
- HR = 1 indicates no change in the hazard
However, they provide a direct interpretation of how the hazard changes with a one-unit change in the covariate.
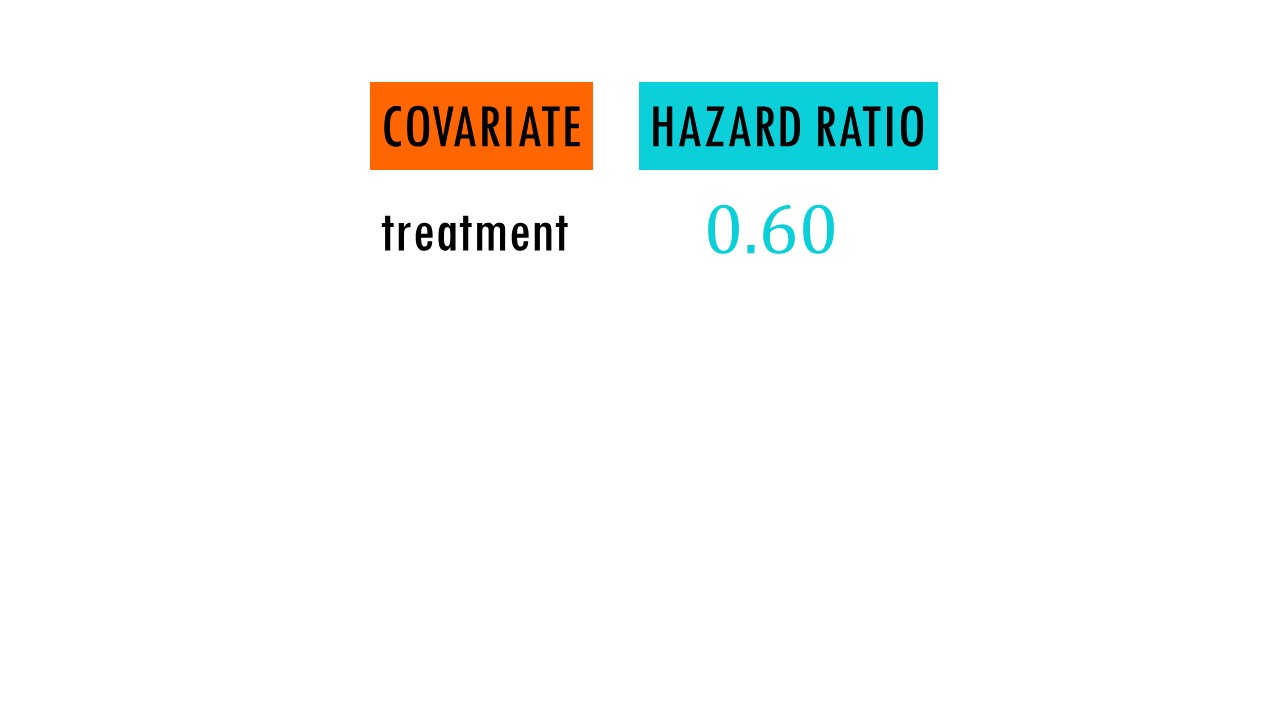
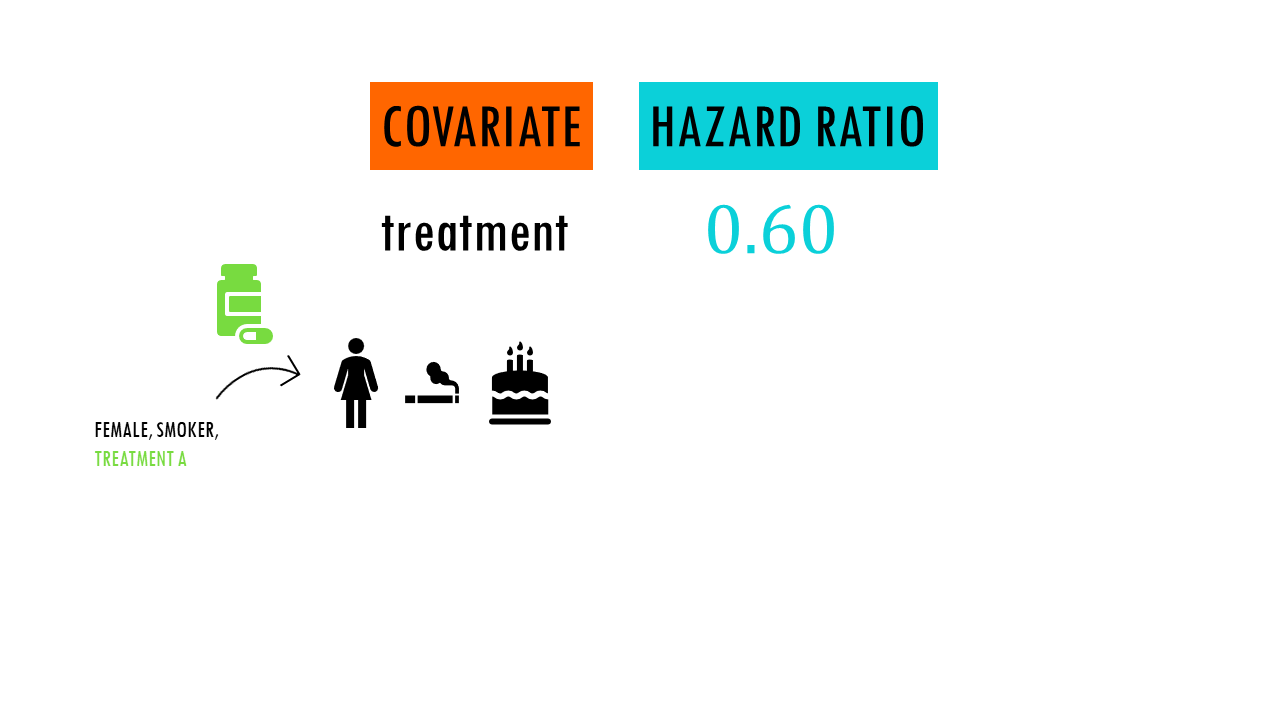
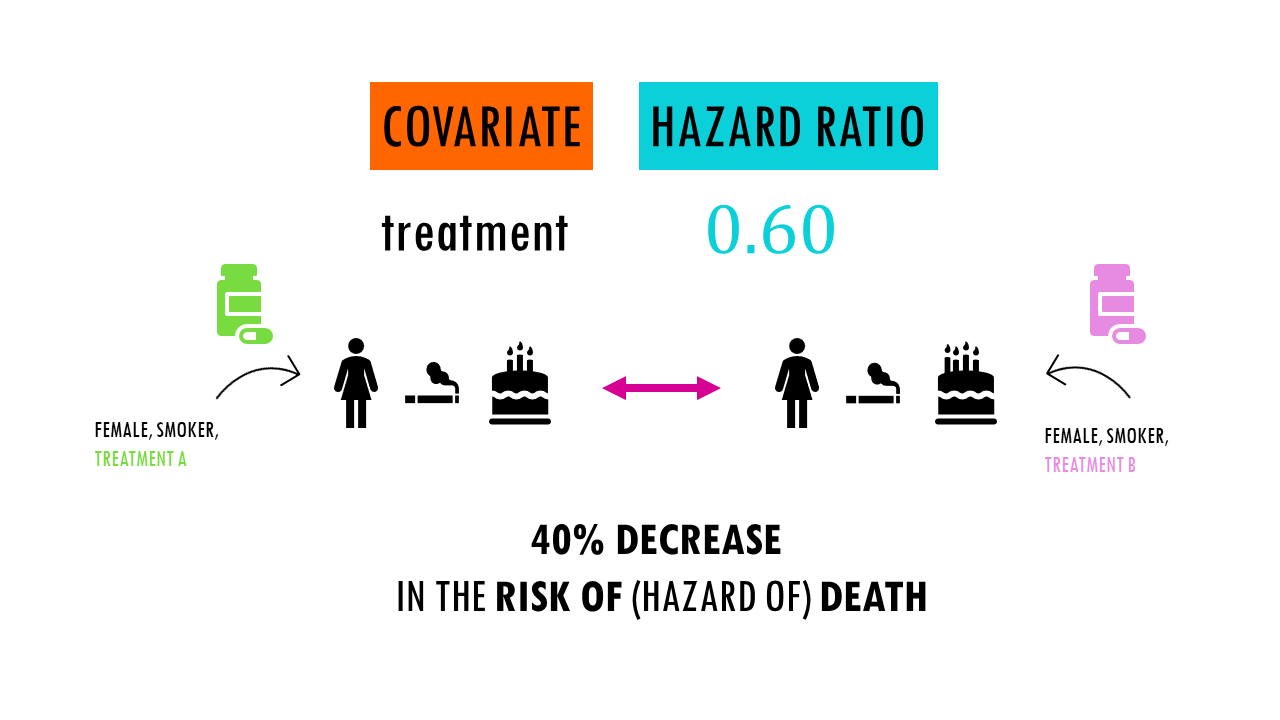
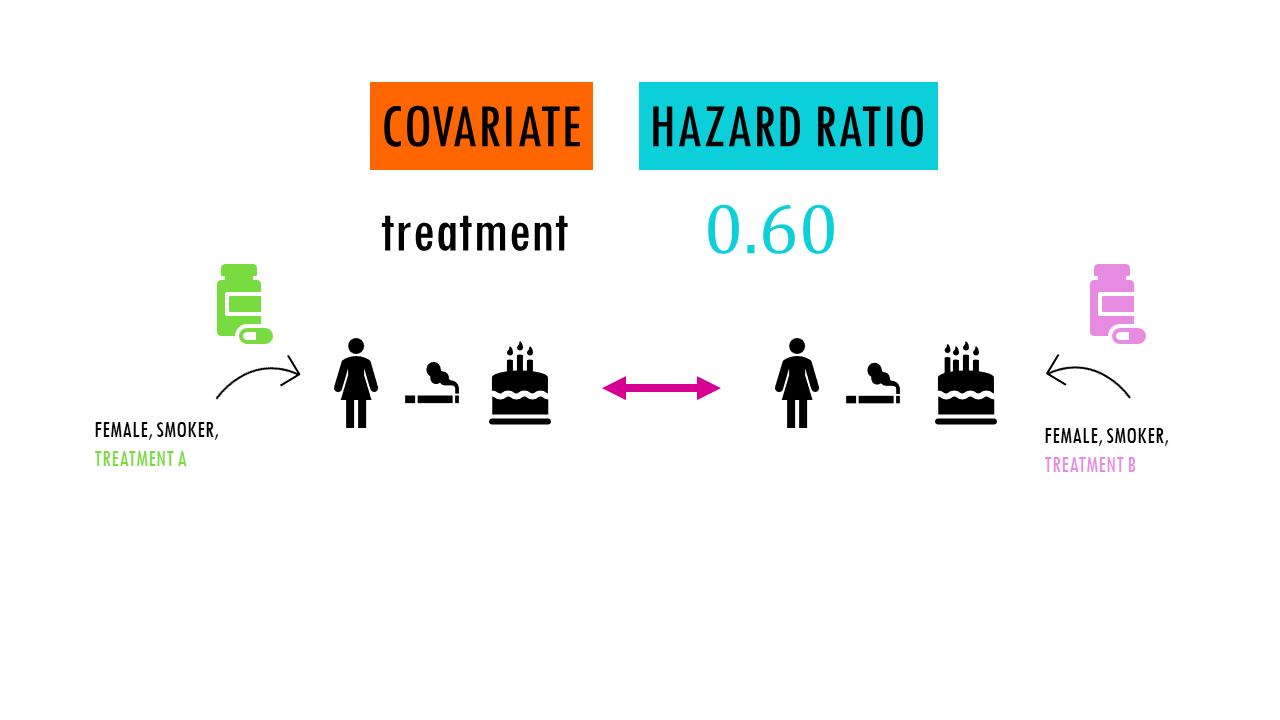
For example, we are studying the effect of a new medication (drug A) on the survival of patients with a specific medical condition. We compare it to a standard treatment (drug B).
We obtain a Hazard Ratio (HR) of 0.60.
This means that patients who received drug A had a 40% lower hazard of death compared to those who received drug B. In other words, the risk of death was reduced by 40% in the drug A group.
Univariate vs multivariate Cox regression
Depending on the number of explanatory variables we use to explain survival time, we can have univariate (one variable) or multivariate (more than one variable) Cox regression.
Univariate Cox Regression looks at the relationship between a single predictor variable (covariate) and the hazard of an event (e.g., death) without considering any other covariates. It helps determine the impact of a specific variable on survival time, independently of other factors.
For example, if you’re studying the survival of cancer patients, univariate Cox regression might assess the effect of a single predictor like tumour size on the hazard of death, without considering other variables.
Multivariate Cox Regression simultaneously includes multiple predictor variables (covariates) in the model to assess their combined influence on the hazard of an event. It allows you to examine the effects of multiple variables while adjusting for potential confounding factors or covariates. This helps in understanding the independent contributions of each covariate.
Continuing with the cancer patient example, multivariate Cox regression might include covariates like age, treatment type, and tumour size together in the model to assess their combined impact on survival.
How to interpret Cox regression results
Let’s take the ‘typical’ example in a clinical trial setting. Imagine we are studying survival time after being diagnosed with a disease. There’s a new promising drug ‘Drug A’ in development and we’d like to see if it improves survival time compared to the current treatment (drug B). But we’d also like to take into account the difference in survival time of females compared to males. And perhaps also age at diagnosis.
Our predictors are thus, the drug used, gender and age. Since we have multiple independent variables or predictors, we need Cox regression.
Let’s have a look at these results:

With a significance threshold of 0.05, only age and gender are significantly associated with the length of survival (p-value < 0.05). The negative coefficient of the treatment (-1.8) means drug A has a poorer association with survival length than drug B, but it is not significantly different.

The coefficient for treatment, -1.8, is the logarithm of the hazard ratio for a patient given drug A compared with a patient given drug B of the same age and gender. The hazard ratio is 0.152, indicating that a person receiving drug A is 0.152 times as likely to die at any time as a patient receiving drug B. In other words, the risk of dying associated with drug A appears to be much lower. However, the confidence interval contains 1, indicating that there may be no difference in risk associated with the two treatments. Moreover, the p-value is above 0.05, meaning the difference between treatments is not significant.

The hazard ratio for age, 1.247, indicates that a patient who is one year older than another patient, both being given the same treatment and same gender, has an increased risk for dying, by a factor of 1.247. Note that, in this case, the confidence interval does not contain 1, indicating the statistical significance of age.

Gender has a negative regression coefficient, meaning that women have a decreased log hazard of death, compared to men. Remember that, to get a more intuitive interpretation, we can exponentiate the coefficient, or look directly at the hazard ratio. In this case, e−0.9 is approximately 0.406. In other words, women have a 60% lower risk of death compared to men.

How is Cox regression calculated?
Stay tuned for a Cox regression analysis tutorial!
Otherwise, I can recommend this webpage to carry out survival analysis in R.
Final notes on Cox regression analysis
In summary, with the Cox proportional hazards model, we can evaluate the effect of different variables on survival time (the time it takes for an event to happen). It also accounts for censoring (individuals who do not experience the event by the end of the study). Unlike the log rank test, Cox regression allows for other explanatory variables to be taken into account.
As with any other statistical test, Cox regression analysis comes with some assumptions about the data. Before you use it to model your survival time, make sure your variables meet the Cox regression assumptions!
Want to know more?
Additional resources
If you would like to know more about common survival time analysis, check out:
You might be interested in…
- Survival time analysis: easily explained!
- Kaplan-Meier curves easily explained
- Log rank test – easily explained!
- If you want to know more about X2 tests, check out my blogpost on Chi-square, easily explained! (coming up)
Ending notes
Wohoo! You made it ’til the end!
In this post, I shared some insights on survival time analysis.
Hopefully you found some of my notes and resources useful! Don’t hesitate to leave a comment if there is anything unclear, that you would like explained differently/ further, or if you’re looking for more resources on biostatistics! Your feedback is really appreciated and it helps me create more useful content:)
Before you go, you might want to check:
Squidtastic!
You made it till the end! Hope you found this post useful.
If you have any questions, or if there are any more topics you would like to see here, leave me a comment down below.
Otherwise, have a very nice day and… see you in the next one!
Squids don't care much for coffee,
but Laura loves a hot cup in the morning!

If you like my content, you might consider buying me a coffee.
You can also leave a comment or a 'like' in my posts or Youtube channel, knowing that they're helpful really motivates me to keep going:)
Cheers and have a 'squidtastic' day!
And that is the end of this tutorial!
In this post, I explained the differences between log2FC and p-value, and why in differential gene expression analysis we don't always get both high log2FC and low p-value. Hope you found it useful!
Before you go, you might want to check:
Squidtastic!
You made it till the end! Hope you found this post useful.
If you have any questions, or if there are any more topics you would like to see here, leave me a comment down below.
Otherwise, have a very nice day and... see you in the next one!

Super helpful, thanks! Any chance you plan to do a tutorial on interpreting Cox model results of time-varying coefficients? I have found a couple different websites explaining but I have not been able to fully grasp the concept.
Hey! Thanks so much for the suggestion, you read my mind haha I just recently had to do that type of analysis. Got a few other videos in mind first but I’m definitely adding it to the todo list:)
Hey, This was really helpful but I wanted to know if you can provide me with the data set you used to calculate the values. And when will we be getting a video on how to solve for Cox Regression?
Hi, thanks for your feedback! The dataset is not real – just made up values to illustrate difference scenarios.
Noting the suggestion down! Thanks so much!