A simple introduction to survival time analysis, Kaplan-Meier curves, Cox regression and more!
Survival time analysis is really common in biostatistics. You might have heard of Kaplan-Meier curves, Cox regressions or the log rank test. In clinical trials, survival time analysis is used to compare the performance of two different kinds of treatment, for example. Survival time analysis can also be used to test whether certain characteristics (e.g., smoking, diet, exercise habits, a mutation in a certain gene…) affect the progression of a disease.
Survival time analysis lets you answer questions like:
- What is the impact of one or more clinical (or non-clinical!) features on patient’s survival? For example, do patients with BRCA1 gene mutation have higher or lower survival rates in patients diagnosed with breast cancer?
- What is the probability that an individual survives 3 years after being diagnosed with a disease?
- Are there differences in survival between groups of patients? For example, do patients treated with drug A live longer than patients treated with drug B?
In this post, we will discuss the main concepts behind survival time analysis – easily explained!
So if you are ready… let’s dive in!
Follow this introduction to Survival time analysis on Youtube with me!
What is survival time analysis?
Survival time analysis, or Time-to-event analysis, is a group of statistical methods we use to investigate the time it takes for an event of interest to occur. In other words, the variable we study is the time until an event occurs.
What is the event? Typical examples of an event of interest in a clinical setting is death or time to relapse. The variable of interest should have a start time (e.g., the moment the patient was diagnosed with the disease) and the event (e.g., death). It’s important to know that survival time analysis focuses on the time between the start time and the event. Time can be measured in days, weeks, months or years.

We talk of ‘survival’ curves but the event of interest does not necessarily need to be death. In fact, survival curves are also used in non-clinical context like engineering or social sciences. For example, you could be looking at the time until sneezing if you are allergic to dogs and you pet one. Or the time between getting a cast for your broken arm and the moment your cast is removed. In this case, your start time is the moment you get a cast, and the end time, the event, is the moment your cast is removed. Some people may have broken their arm in February, some in March, some a year later. You are not focused on specific days but the time between the two events. This is called serial time.

Squidtip
In survival time analysis, the time considered may have nothing to do with the actual “survival time”, but it is still called survival time and survival time analysis. For example, you could measure the time it takes a dishwasher to break, once it is bought.
Survival analysis – easily explained with an example!
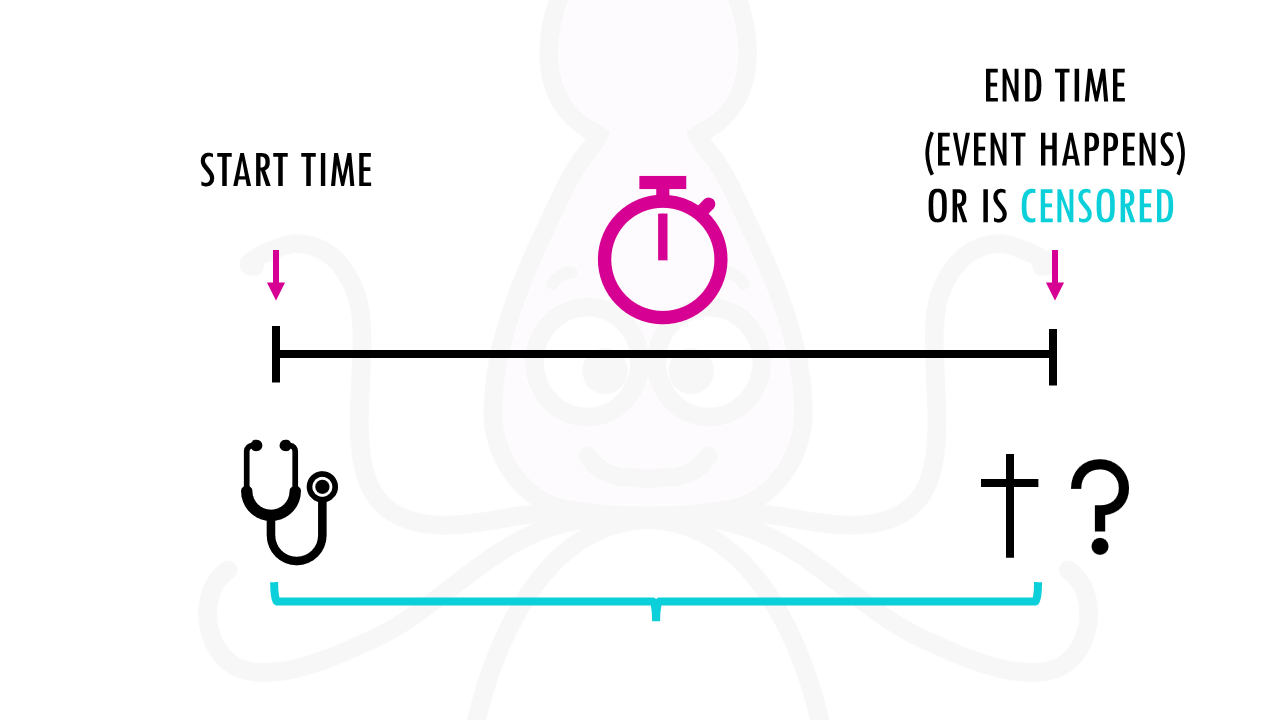
As we said, survival analysis measures the time from a starting point (e.g., patient enrolled in the clinical trial, or first dose of chemotherapy) and the ending point. The end point can be when the event of interest happens, or when the patient is censored (more on this in just a bit).
Let’s consider you are a hairdresser and want to study the ‘survival time’ of a haircut.
Your start time is the moment the person comes in for a haircut. The end time, or the event, is the moment the client comes back in to get a haircut again. You are now interested in the time between those two events: how long does a haircut last.
You start collecting data of the people who come into your hairdresser salon and write down when they get their haircut. Then, when they come again to get a second haircut, you note that down as well.
But what if the person didn’t come back to get a second haircut? Perhaps they decided to go to another hairdresser and got a haircut somewhere else. Or they moved and now live elsewhere. Or they went bald and no longer need haircuts. Or decided to go Rapunzel mode and never cut their hair again.
Sometimes, we simply don’t know when did the event happen. That’s when we need censoring.
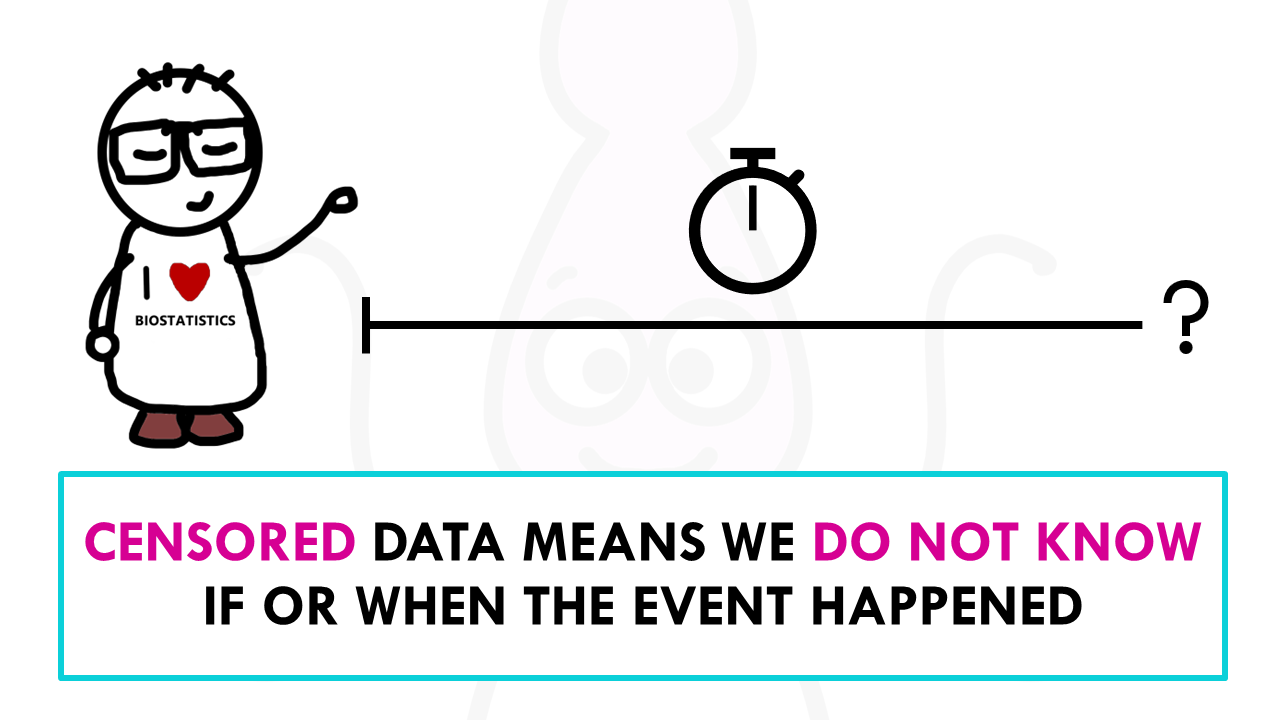
What is censoring?
Firstly, it’s important to remember that a study cannot go on indefinitely. You cannot keep gathering data forever. At some point you are going to want to stop collecting data and create that survival analysis curve! So every study has a clear start and date.
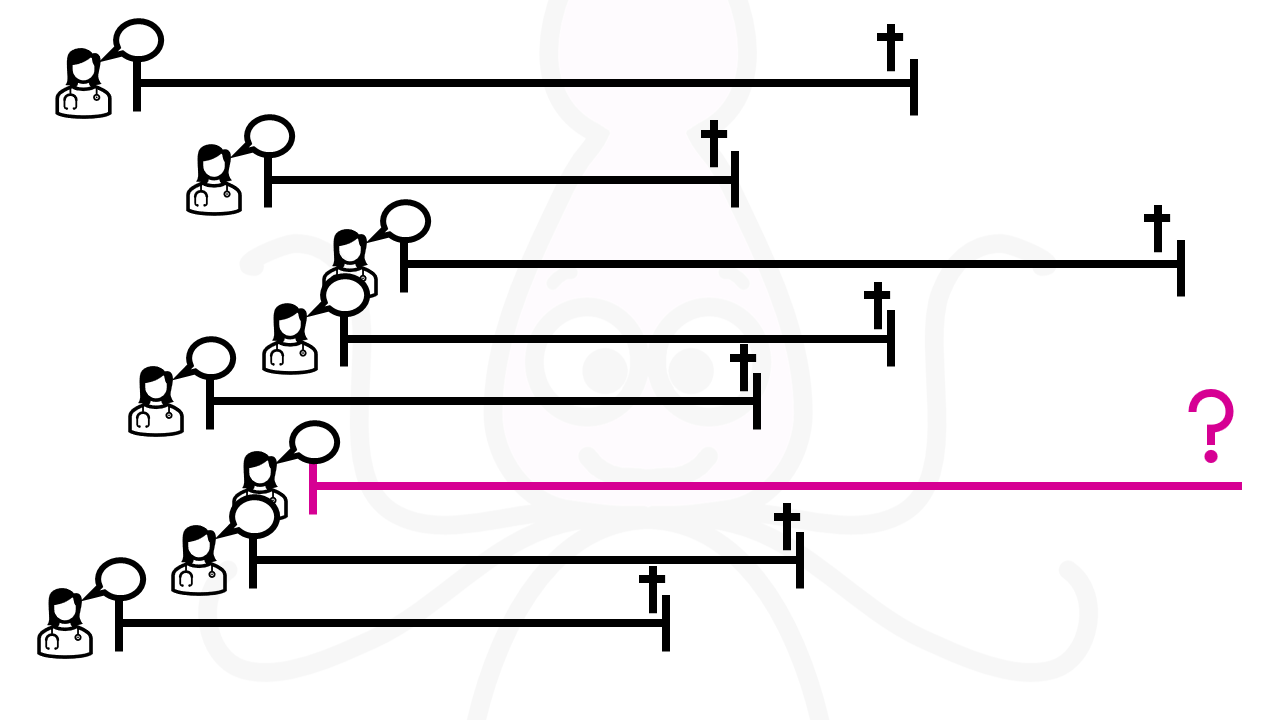
If you decided to start your study the 12th of October 2023, and finish it on the 12th of October 2025, you can only consider cases which started and ended in this time period. So people who came for their first and second haircuts between this time period. We can then consider that the event has occurred. For those people who got the first haircut, but never came back to get a second one in that period of time, you do not know when or if the event occurred. If a certain client came for his/her second haircut a day after you decided to end the study, we cannot consider him/her: that case will be censored.
Squidtip
Cases where data is not fully available is censored data. We will learn how to manage censored data in the Kaplan-Meier curve tutorial.
In a clinical trial context, censoring means the total survival time for that patient cannot be accurately determined. In many cases, we study ‘actual’ survival time, where the event of interest is death. Reasons for this can be that the patient dropped out of the study or is lost to follow-up, or simply the patient survived at least until the end of the study (the event, death, never happened), but no there is no knowledge of what happened after. In conclusion, censoring can occur within the study or terminally at the end.
Methods of survival time analysis
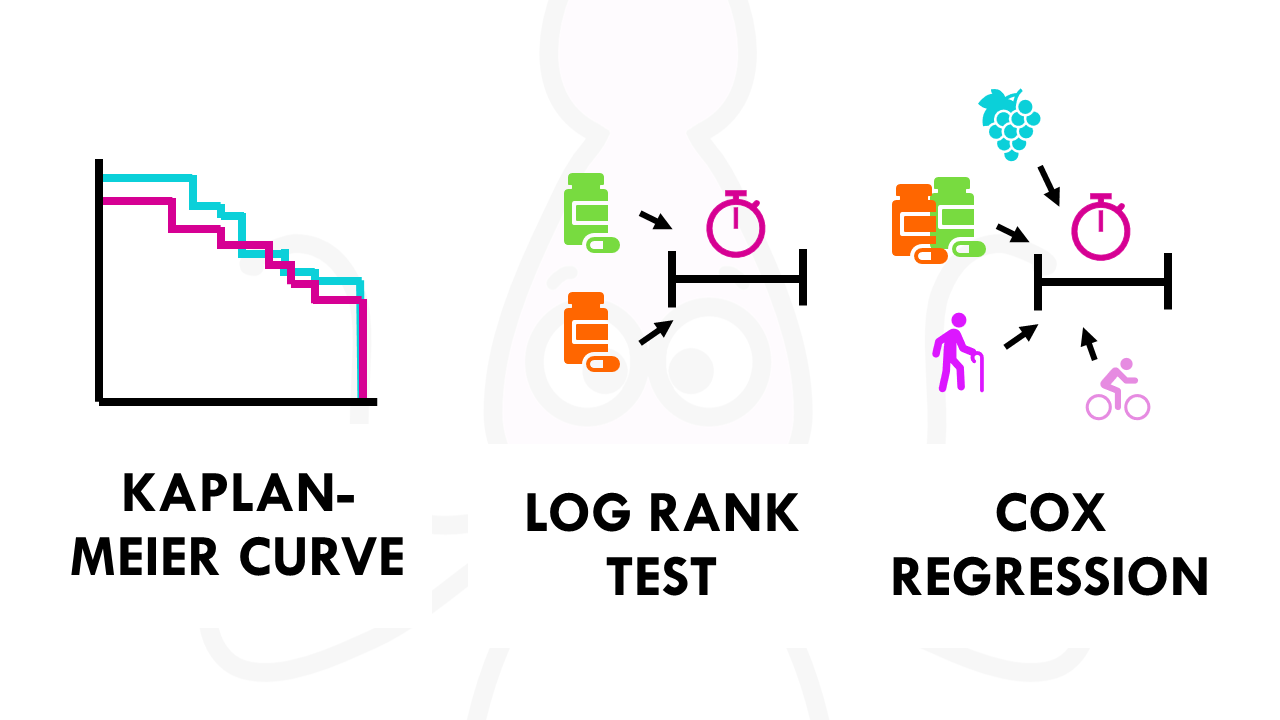
So how do we actually conduct survival time analysis? The three most common methods of survival time analysis are:
- the Kaplan Meier survival time curves
- the log rank test, and
- Cox regression.
More on each of them in separate blogposts!
Want to know more?
If you would like to know more about common survival time analysis, check out:
You might be interested in…
Ending notes
Wohoo! You made it ’til the end!
In this post, I shared some insights on survival time analysis.
Hopefully you found some of my notes and resources useful! Don’t hesitate to leave a comment if there is anything unclear, that you would like explained differently/ further, or if you’re looking for more resources on biostatistics! Your feedback is really appreciated and it helps me create more useful content:)
Before you go, you might want to check:
Squidtastic!
You made it till the end! Hope you found this post useful.
If you have any questions, or if there are any more topics you would like to see here, leave me a comment down below.
Otherwise, have a very nice day and… see you in the next one!
Squids don't care much for coffee,
but Laura loves a hot cup in the morning!
If you like my content, you might consider buying me a coffee.
You can also leave a comment or a 'like' in my posts or Youtube channel, knowing that they're helpful really motivates me to keep going:)
Cheers and have a 'squidtastic' day!

0 Comments