
Simple explanation of what is correlation, positive and negative correlation, and the correlation coefficient r.
In this post I will try to give you a simple and practical explanation of correlation.
Correlation is one of the most used statistical techniques. However, it is very often misinterpreted.
Correlation is actually the basis of many biological studies, from gene expression analysis to analysis of clinical trials data.
I hope this easy explanation helps to get a sense of what is correlation and how to know if two variables are correlated. I will also give you a lot of examples of positive correlation, negative correlation, and examples of uncorrelated variables.
If you are more of a video-based learner, you can check out my Youtube video, otherwise, just keep reading!
Let’s dive in!
You might notice that when ice cream sales increase, so do shark attacks.
When ice cream sales decrease, so do shark attacks.
Does this mean that eating ice cream causes shark attacks?
Of course not!
In this case, sunny weather is making more people eat ice cream. Also, with good weather, more people swim in the sea, which in turn increases the chances of a shark attack. Ice cream sales and shark attacks are correlated, which does not mean ice cream sales cause shark attacks or the other way around.

In one sentence,
Correlation does not imply causation.
Let’s take a look at the differences between correlation and causation.
Causation means that one variable (often called the predictor variable or independent variable) causes the other (often called the outcome variable or dependent variable).

Correlation measures how two variables are related, so the association between the two variables.
When two variables are correlated, we cannot conclude that one variable causes a change in the other. This relationship could be coincidental, or a third factor may be causing both variables to change.
For example, you might notice that the more people walk with umbrellas, the more hot cocoa sales there are. When cocoa sales decrease, so does the number of people walking outside with umbrellas. From this we can only conclude that both variables are correlated. Walking with umbrellas does not cause hot cocoa sales to increase (or vice versa), but rather a third variable (the rain), is causing both variables to increase.

How do we know if two variables are correlated?
To visualise if 2 variables are correlated, we can plot them in a scatterplot.
If there is a correlation, an overall pattern can be seen when the variables are plotted on a scatterplot.
If this pattern can be approximated by a line, the correlation is linear.

Otherwise, the correlation is non-linear.

So, in summary, a great way to visualise if two variables are correlated is through a scatterplot.
Variables that are correlated form a pattern.
If there is a correlation between two variables, an overall pattern can be seen when the variables are plotted on a scatterplot.
There are three types of correlation
There are three ways to describe correlations between variables.
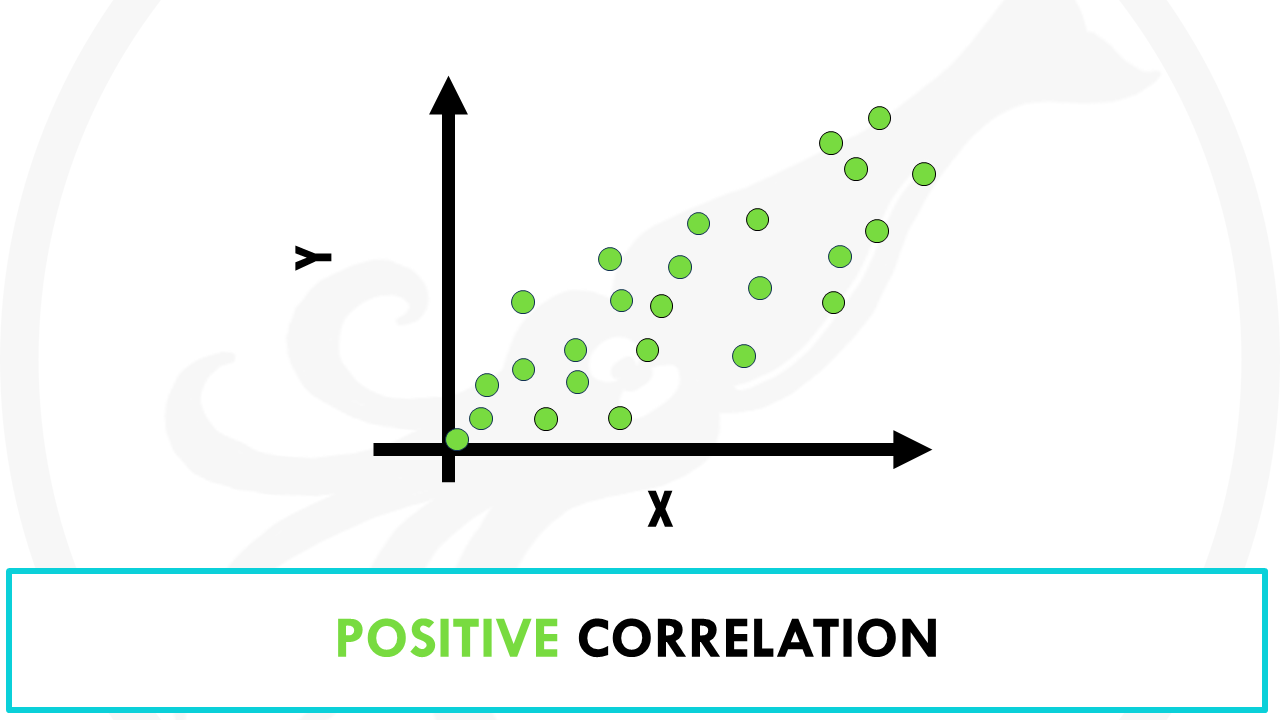
- Positive correlation: as x increases, y tends to increase, and viceversa. An example of positive correlation would be height and weight. Taller people tend to be heavier.
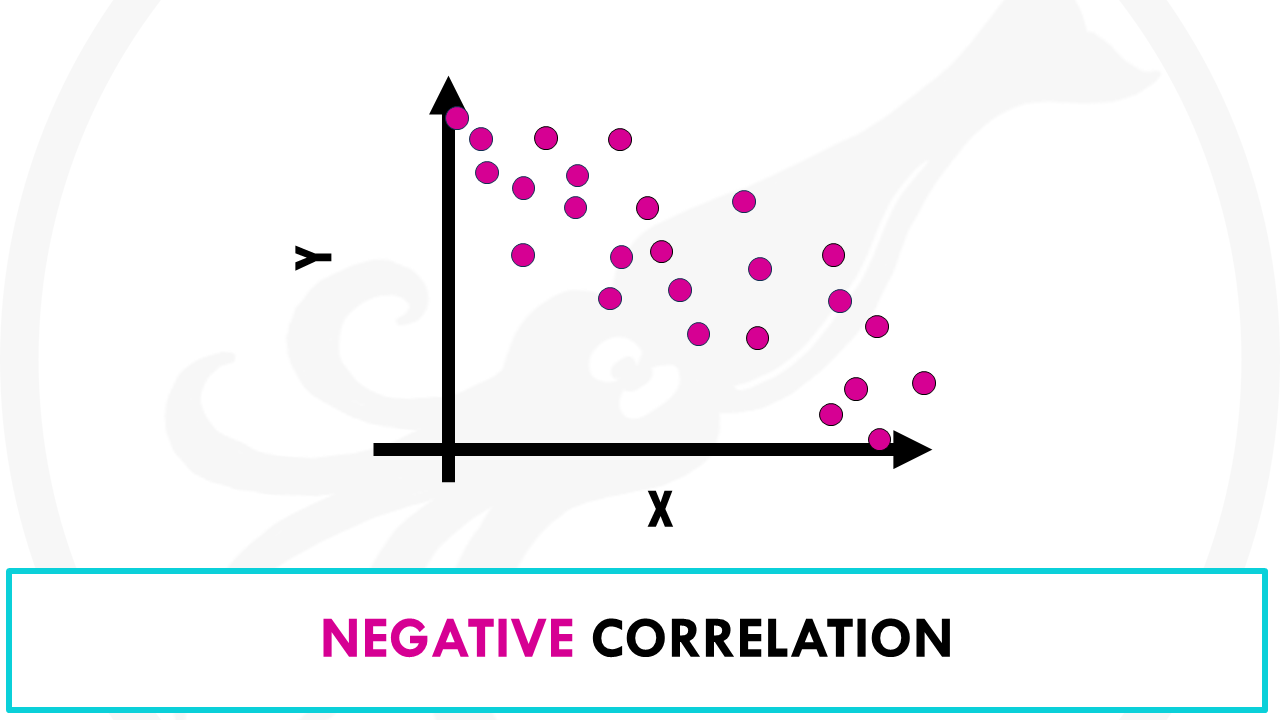
- Negative correlation: as x increases, y tends to decrease, and viceversa. For example, increased exercise is correlated with less heart disease.
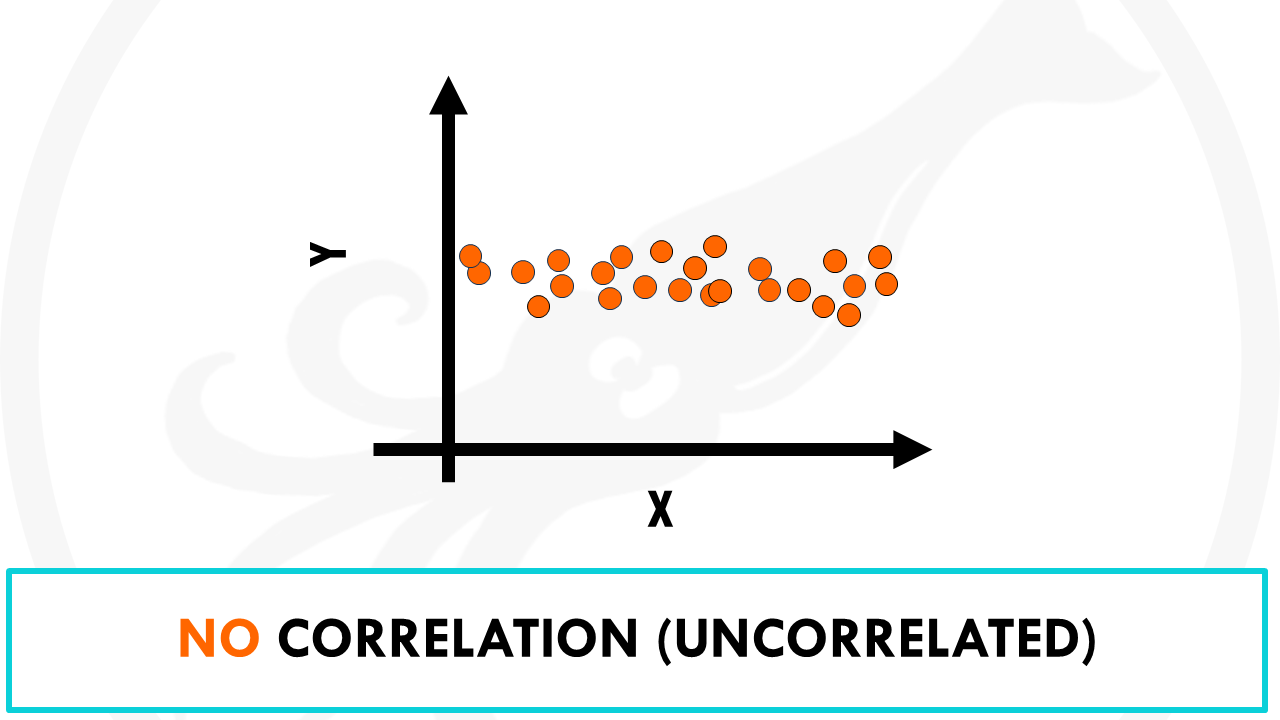
- No correlation (uncorrelated): as x increases, y tends to stay about the same or have no clear pattern. For example, coffee consumption vs. intelligence. The amount of coffee that individuals consume and their IQ level has a correlation of zero. In other words, knowing how much coffee an individual drinks doesn’t give us an idea of what their IQ level might be.


Let’s look at one last example.
You might notice that places with higher numbers of sunburns have also higher number of cases of skin cancer.
Does this mean that sunburns cause skin cancer?
No! with this data, we cannot say that sunburns cause skin cancer.

But wait a minute.
We can design an experiment to determine causation.
For example, randomised controlled trials can provide good evidence of causal relationships. The goal is to isolate, and manipulate the independent variable to observe its effect on the dependent variable and control the environment so that other variables are eliminated.

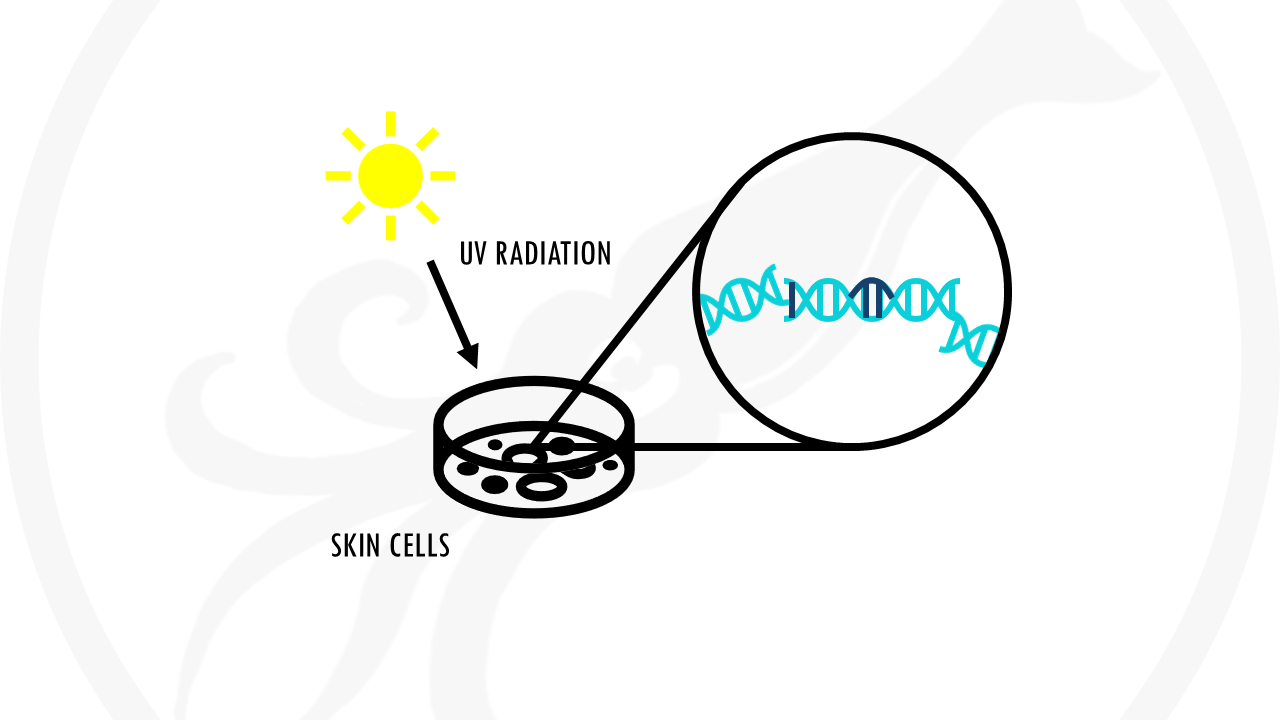
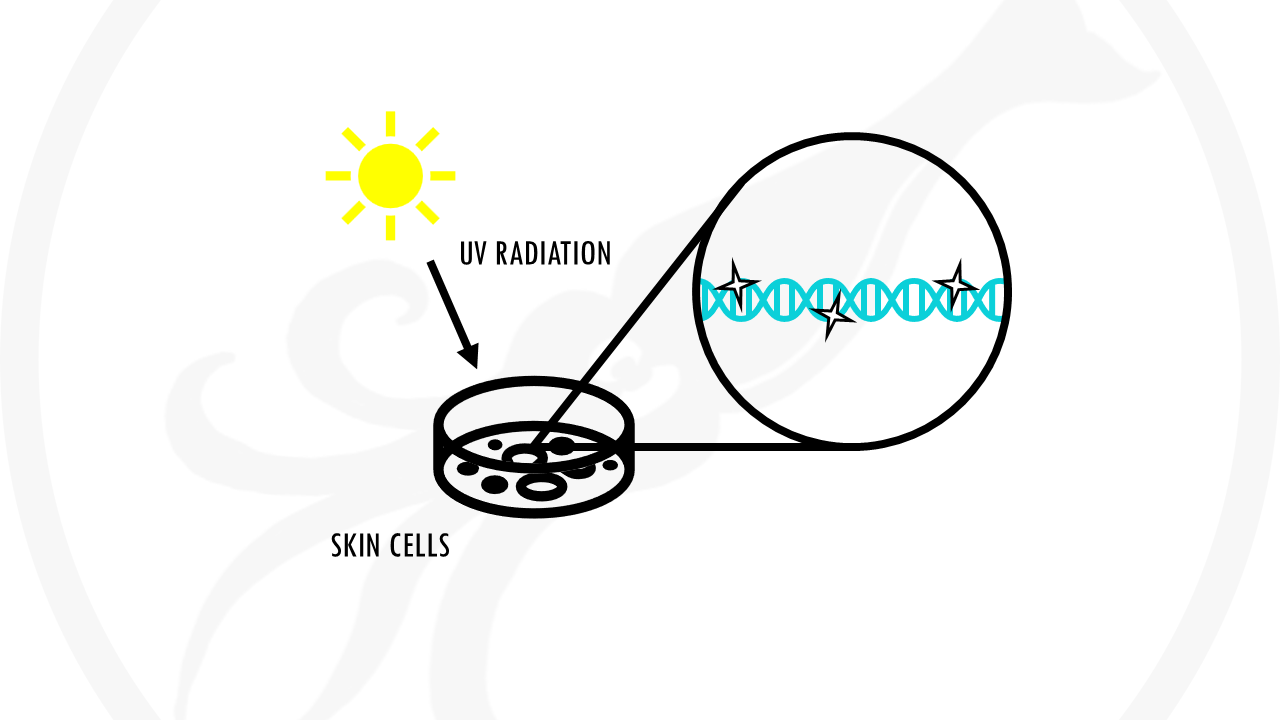
For example, we know that sunburns are caused by UV radiation from the sun. We will find that UV radiation damages DNA in our skin cells. If enough DNA damage build up over time and affects specific genes à it can cause cells to start growing out of control. This is the start of skin cancer.
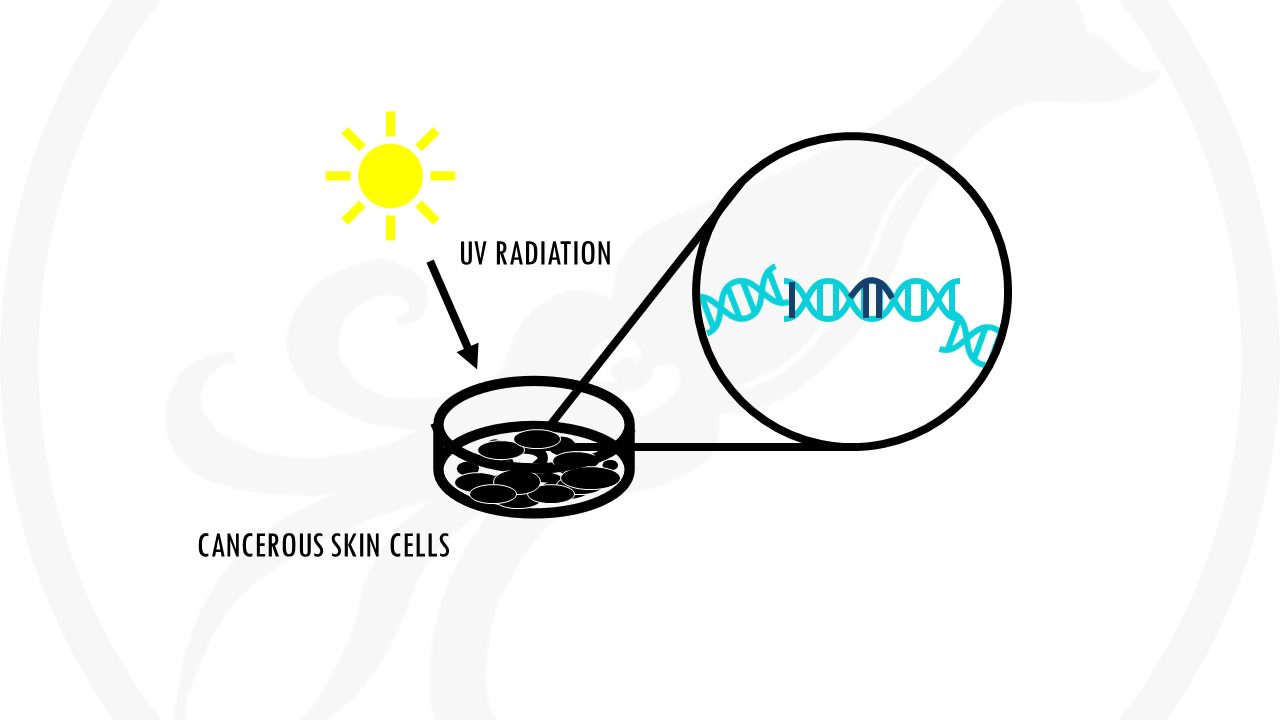
So no, sunburn itself does not cause skin cancer. It’s positively correlated to skin cancer. But there are many more factors to take into account.
However, overexposure to the dangerous ultraviolet radiation that damages skin cells, weakening them and creating the opportunity for cancer to form.
Don’t forget to wear sunscreen in the sun!

Variables can be positively correlated, if they change in the same direction, negatively correlated, if they change in opposite directions, or uncorrelated.
How do we measure correlation?
Correlation is measured with the correlation coefficient r.
The correlation coefficient shows both the strength and direction of correlation.
It takes values from -1 to +1.

A positive correlation coefficient (r > 0) means, as you can probably guess, a positive correlation between two variables. That is, they move in the same direction. The higher r is, the stronger the correlation is. When r = 1 that is a perfect positive correlation, meaning that if 1 variables increases or decreases by 10%, the other will increase and decrease also by 10%.
If the correlation is 0 (r = 0), there is no correlation, no association between the two variables. Remember the scatterplot can either show that Y does not really change even if X changes, or that there is no clear pattern.
A negative correlation coefficient (r < 0) means a negative correlation. The lower it is, the stronger the negative correlation is. If r = -1, it means there is a perfect negative correlation between the two variables: if one variable moves by 10%, other variables will also move by 10% in the opposite direction.


And that is the end of this tutorial!
In this post, I explained the differences between log2FC and p-value, and why in differential gene expression analysis we don't always get both high log2FC and low p-value. Hope you found it useful!
Before you go, you might want to check:
Squidtastic!
You made it till the end! Hope you found this post useful.
If you have any questions, or if there are any more topics you would like to see here, leave me a comment down below.
Otherwise, have a very nice day and... see you in the next one!
