by Biostatsquid | Nov 26, 2023 | Learning, Statistics
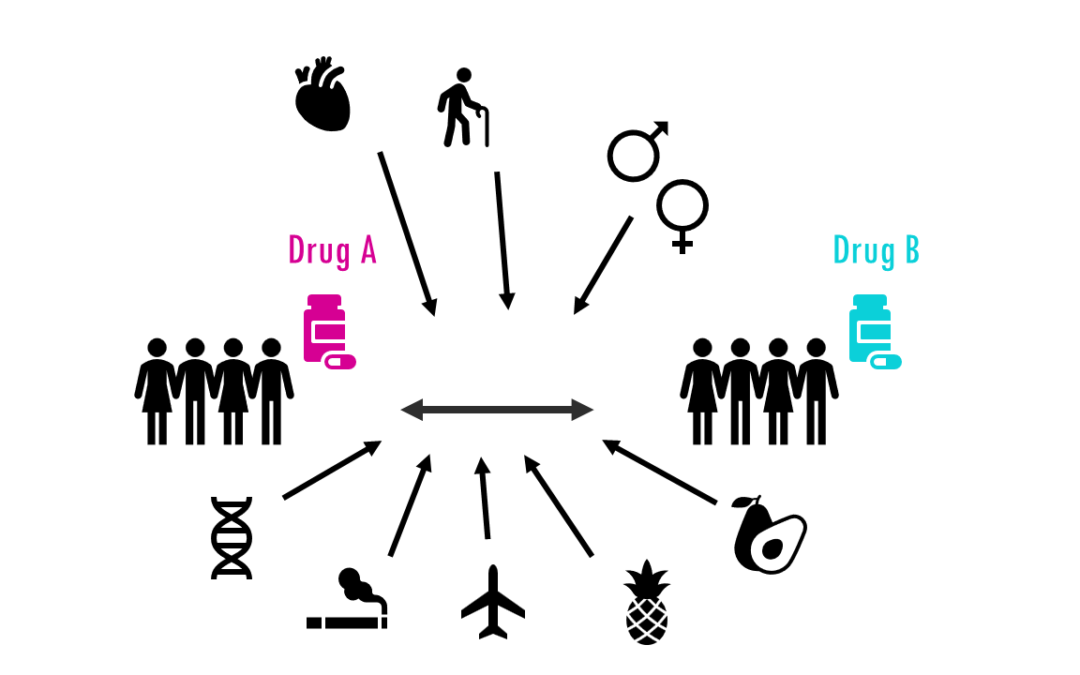
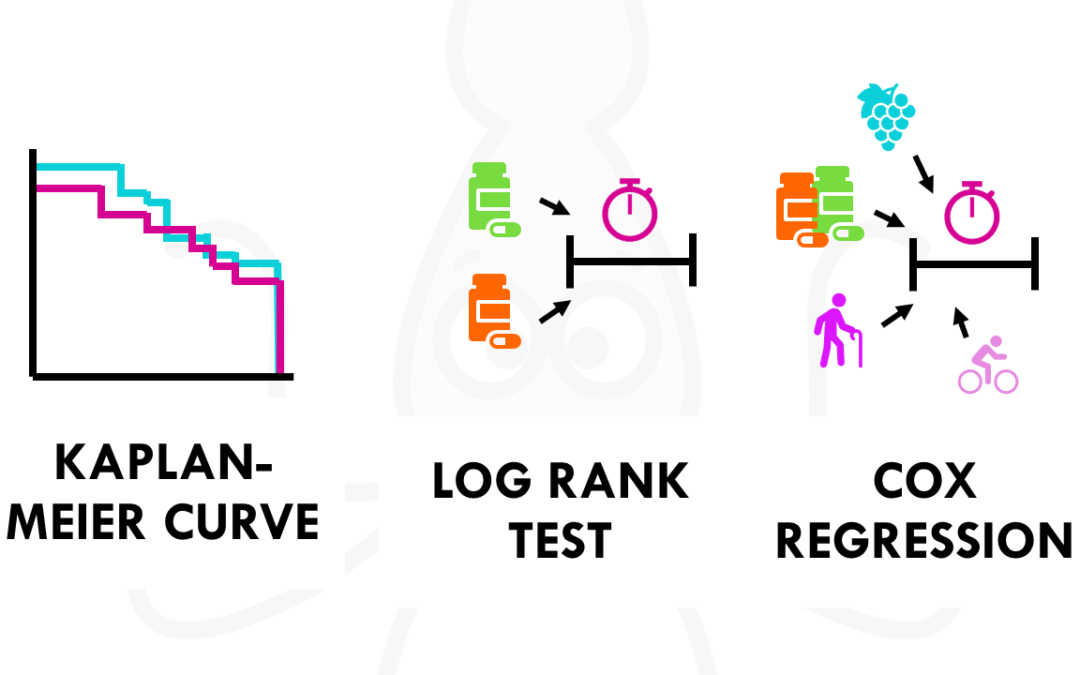
A simple explanation of Cox regression and hazard ratios for survival time analysis Survival time analysis studies a variable with a start time and an end time, which is when a certain event occurs. The event could be death, but also be relapse after chemotherapy, a...
by Biostatsquid | Nov 16, 2023 | Tutorials, Visualisation
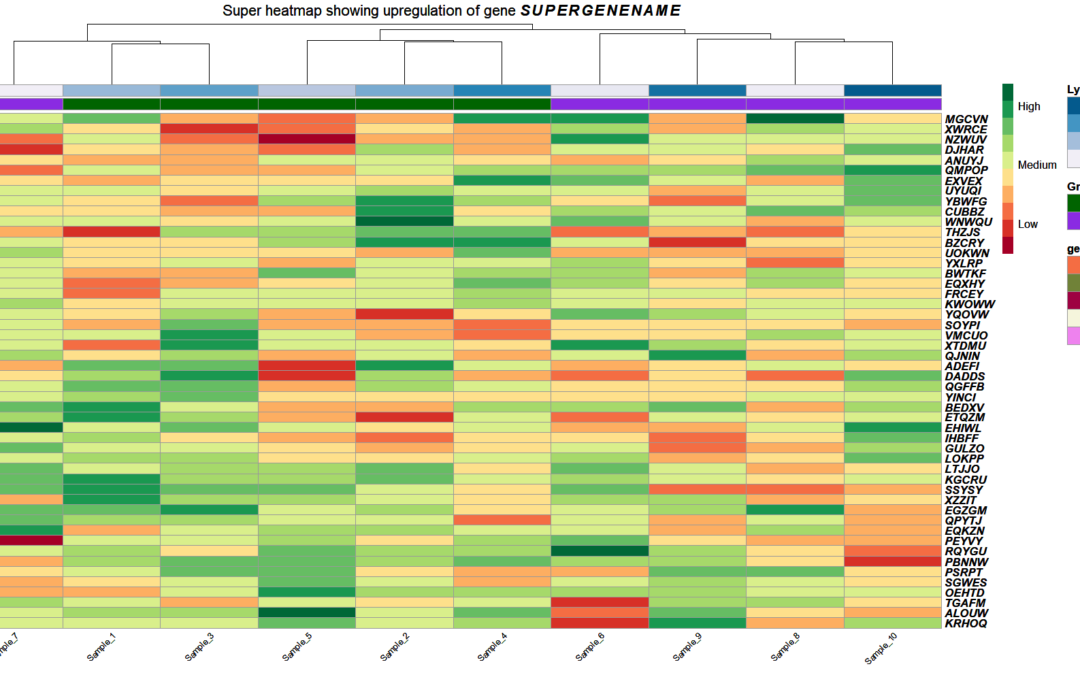
In this post, I will show you how to use italics in plots in R. This is very useful when you want to display gene names or species names correctly. You can easily customise your text in R plots to include italics, bold and more! To show you how you can italicize text...
by Biostatsquid | Nov 7, 2023 | Learning, Statistics
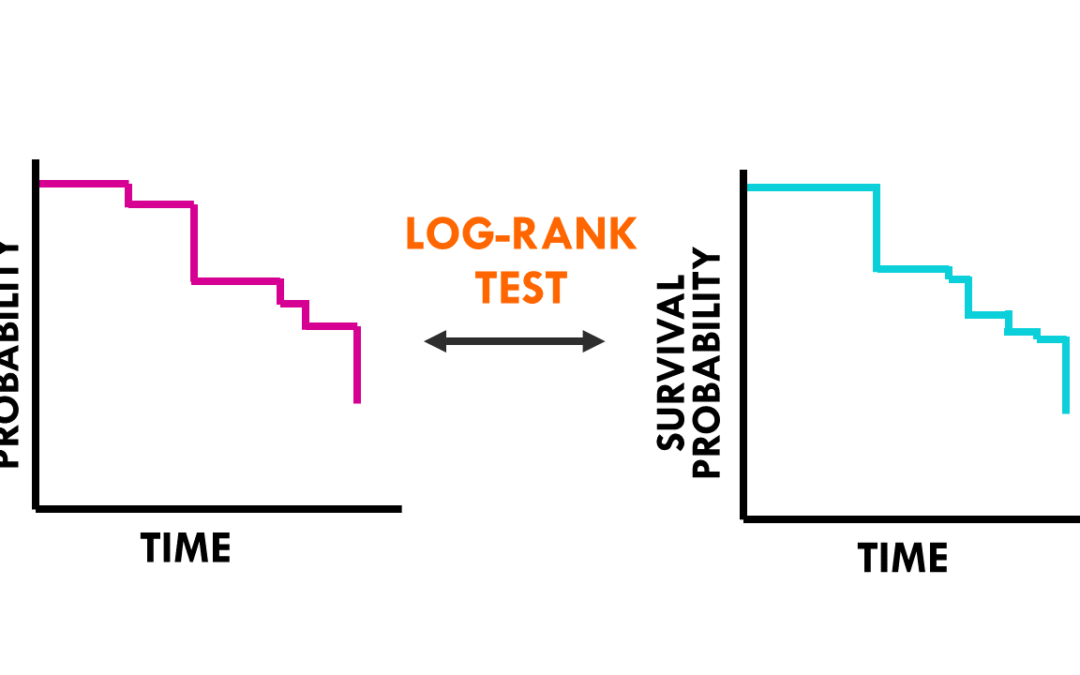
A simple explanation of the log rank test to evaluate differences between survival curves Previously, we talked about survival analysis and the Kaplan-Meier curve. In this post, I will explain how to interpret the log rank test for survival analysis. Before we start,...
by Biostatsquid | Oct 22, 2023 | Statistics
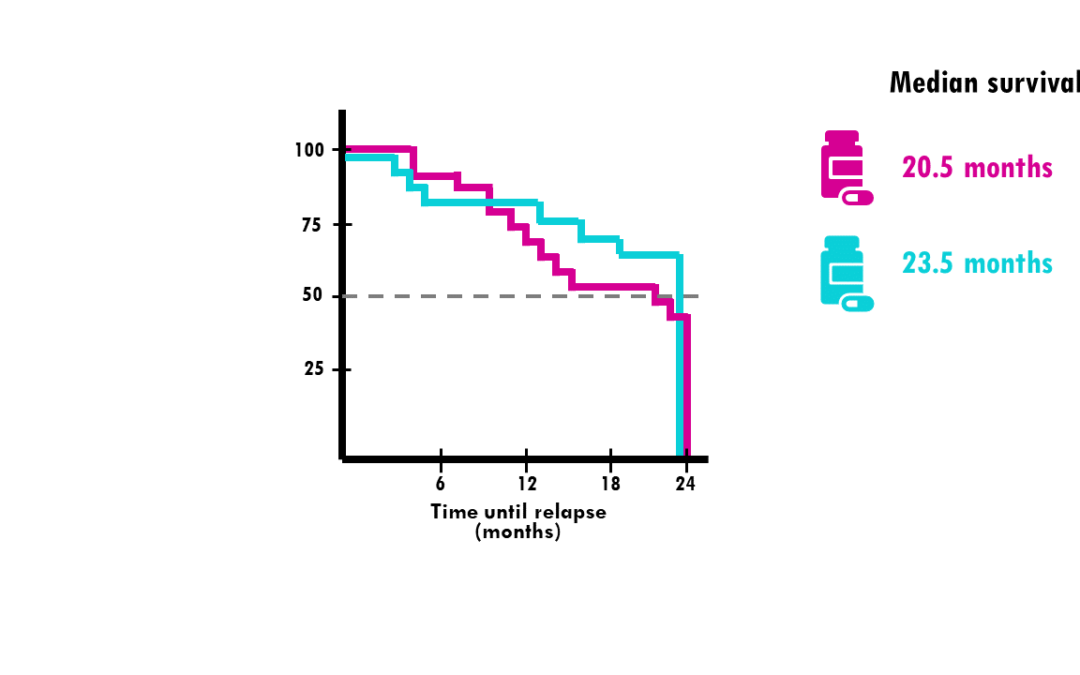
A simple explanation of Kaplan-Meier curves and how to interpret them! In my previous blogpost, we talked about survival time analysis. In a nutshell, survival time analysis, is a group of statistical methods we use to investigate the time it takes for an event of...
by Biostatsquid | Oct 21, 2023 | Learning, Statistics
A simple introduction to survival time analysis, Kaplan-Meier curves, Cox regression and more! Survival time analysis is really common in biostatistics. You might have heard of Kaplan-Meier curves, Cox regressions or the log rank test. In clinical trials, survival...

 This work is licensed under
CC BY-NC-SA 4.0
.
This work is licensed under
CC BY-NC-SA 4.0
.