by Biostatsquid | Jun 16, 2024 | Learning, Statistics
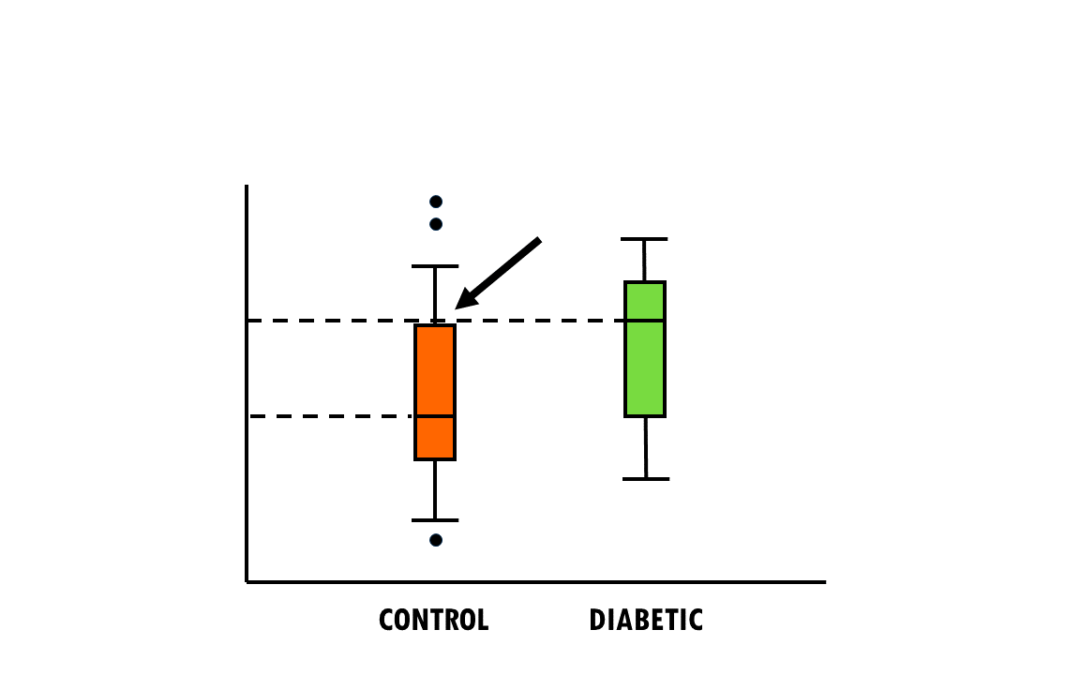
A short but simple explanation of boxplots and violin plots – easily explained with an example! Violin plots and boxplots are a great way to visualise and compare a continuous variable across different groups or categories. For example, you might want to find...
by Biostatsquid | May 26, 2024 | Learning, Statistics
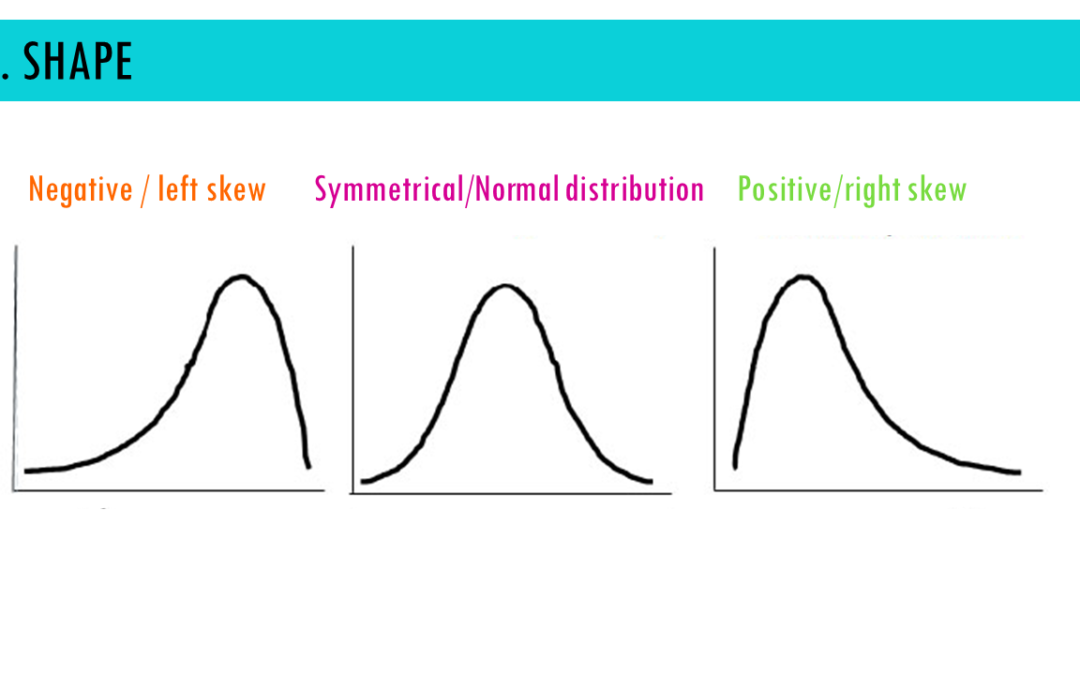
A short but simple explanation of density plots – easily explained with an example! Density plots are a great way to visualise the distribution of continuous variables. For example, you might want to find out within which range of weights most of your mice fall....
by Biostatsquid | Apr 2, 2024 | Learning, Machine learning, Statistics
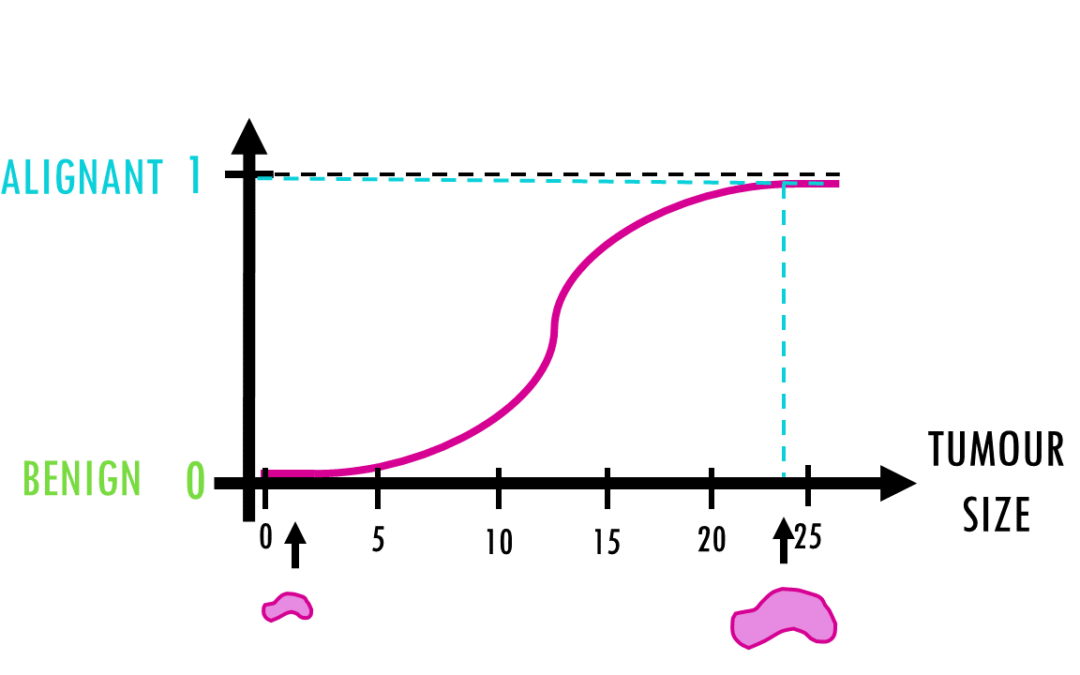
A short but simple explanation of logistic regression – easily explained with an example! Logistic regression is a statistical model (also known as logit model) which is often used for classification and predictive analytics. But what is logistic regression?...

by Biostatsquid | Mar 23, 2024 | BiostatTOOLS
Here is a compilation of useful webpages, publications, tools and other bioinformatic resources! To access my top bioinformatic tools and resources you can click here or just keep scrolling. If you’d know of any cool tool or website that’s missing, please...

by Biostatsquid | Mar 11, 2024 | scRNAseq, Tutorials
A step-by-step easy R tutorial for cell type annotation with SingleR In this easy, step-by-step tutorial you will learn how to to do cell type annotation with the R package SingleR. SingleR is a popular reference-based automatic cell type annotation tool used to...

 This work is licensed under
CC BY-NC-SA 4.0
.
This work is licensed under
CC BY-NC-SA 4.0
.