by Biostatsquid | Jul 15, 2025 | scRNAseq, Tutorials
Hey! You’re looking at an old post. Newer version here: fgsea tutorial in R A step-by-step R tutorial on performing Gene Set Enrichment Analysis with R package fgsea In this tutorial you will learn how to conduct Gene Set Enrichment Analysis (GSEA) using...
by Biostatsquid | Jun 24, 2025 | Statistics
Setting thresholds for differential gene expression (DGE) analysis is crucial and depends on several factors. In essence, for a list of genes, we are trying to define what counts as biologically meaningful versus just statistically significant. The question is…...
by Biostatsquid | Jun 6, 2025 | Learning, Statistics, Statistics in R, Tutorials
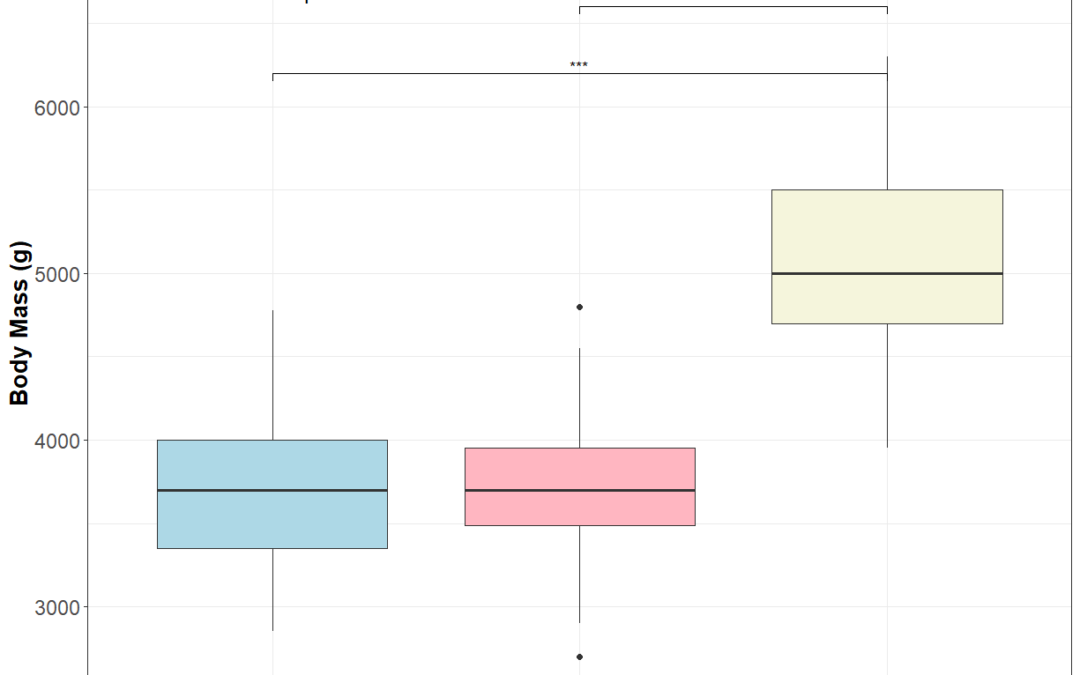
When working with biological data, we often want to compare measurements across multiple groups. However, these measurements aren’t always normally distributed. In such cases, non-parametric methods like the Kruskal-Wallis test and Dunn’s post-hoc test are ideal...

by Biostatsquid | May 5, 2025 | scRNAseq, Tutorials
A step-by-step easy R tutorial to preprocess scRNAseq data with Seurat v5 In this easy, step-by-step tutorial you will learn how a Seurat object is structured and how to preprocess scRNAseq data using the standard workflow with Seurat v5. This is a hands-on...

by Biostatsquid | Apr 27, 2025 | Learning, RNAseq, scRNAseq
Understanding the structure of Seurat objects version 5 – step-by-step simple explanation! If you’ve worked with single-cell RNAseq data, you’ve probably heard about Seurat. In this blogpost, we’ll cover the the Seurat object structure,in...

 This work is licensed under
CC BY-NC-SA 4.0
.
This work is licensed under
CC BY-NC-SA 4.0
.