by Biostatsquid | Nov 6, 2025 | Learning, RNAseq, Statistics
How to interpret MA plots How to interpret MA plots In this blogpost, we will go over the basics of an MA plot which is a very useful visualisation for genomics and transcriptomics data. We will go over the basics of MA plots and how to interpret them. This is the...
by Biostatsquid | Aug 24, 2025 | Learning, Statistics
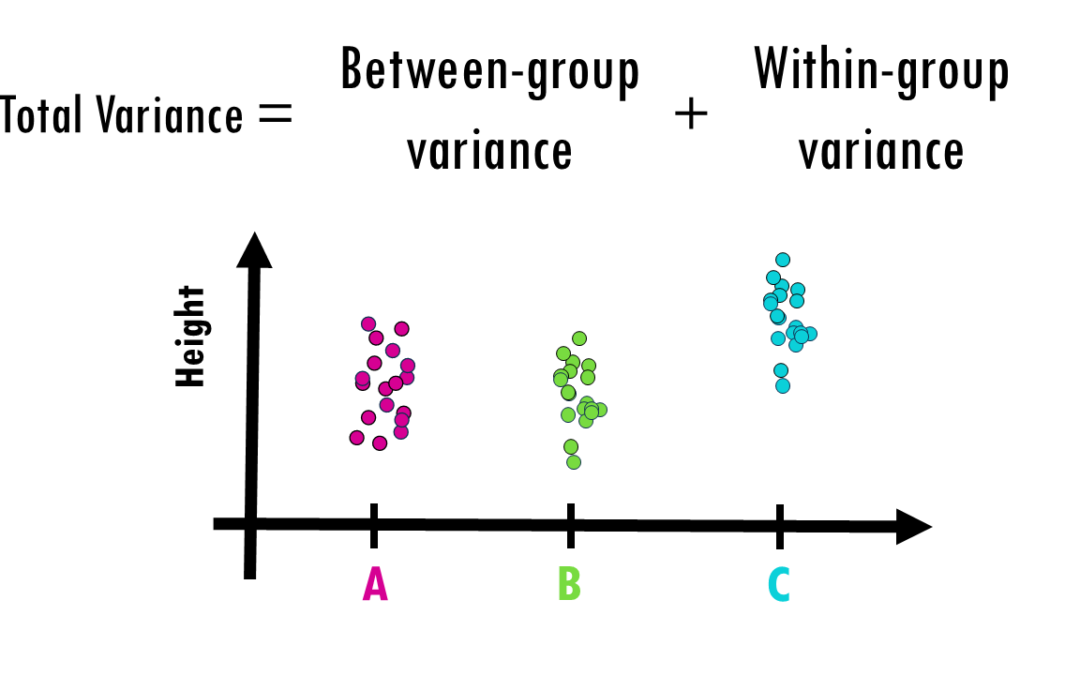
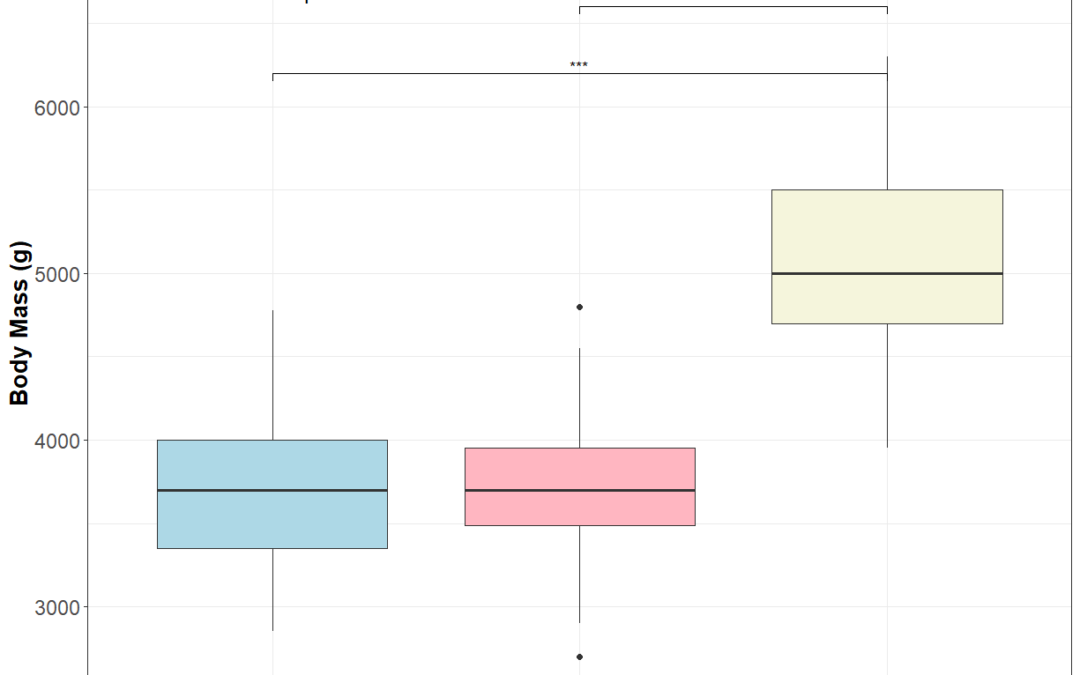
How to interpret ANOVA (analysis of variance) easily explained! When you’re working with data and want to determine whether different groups have significantly different averages, simply eyeballing the numbers won’t cut it. That’s where ANOVA (Analysis of...
by Biostatsquid | Jul 15, 2025 | RNAseq, scRNAseq, Tutorials, Uncategorized
Hey! You’re looking at an old post. Newer version here: clusterProfiler tutorial in R R TUTORIAL: Perform pathway enrichment analysis with clusterProfiler() in R Table of contents 5 Before you start 5 Step-by-step clusterProfiler tutorial 9 Step 0: Set up your...
by Biostatsquid | Jun 24, 2025 | Statistics
Setting thresholds for differential gene expression (DGE) analysis is crucial and depends on several factors. In essence, for a list of genes, we are trying to define what counts as biologically meaningful versus just statistically significant. The question is…...
by Biostatsquid | Jun 6, 2025 | Learning, Statistics, Statistics in R, Tutorials
When working with biological data, we often want to compare measurements across multiple groups. However, these measurements aren’t always normally distributed. In such cases, non-parametric methods like the Kruskal-Wallis test and Dunn’s post-hoc test are ideal...

by Biostatsquid | Apr 27, 2025 | Learning, RNAseq, scRNAseq
Understanding the structure of Seurat objects version 5 – step-by-step simple explanation! If you’ve worked with single-cell RNAseq data, you’ve probably heard about Seurat. In this blogpost, we’ll cover the the Seurat object structure,in...

 This work is licensed under
CC BY-NC-SA 4.0
.
This work is licensed under
CC BY-NC-SA 4.0
.