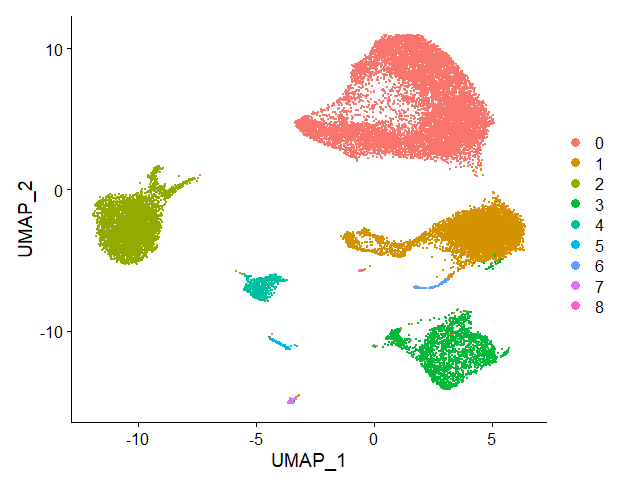
by Biostatsquid | Jan 10, 2023 | scRNAseq, Tutorials
R TUTORIAL: Pre-process your scRNAseq data with this easy, step-by-step pipeline Table of contents 5 Before you start 5 scRNAseq pre-processing pipeline: complete script 5 Step-by-step guide to analyse your data with Seurat 9 Step 1: Set up your script 9 Step 2:...
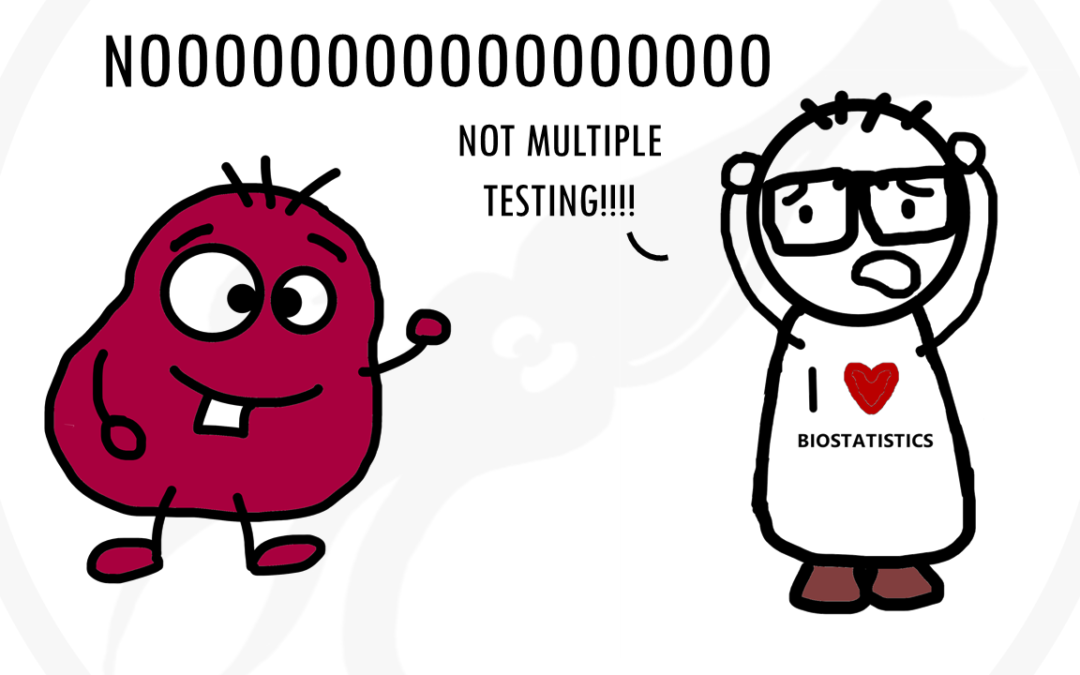
by Biostatsquid | Nov 24, 2022 | Learning, Statistics
A simple explanation of what is multiple testing and how it can negatively affect your data. We will also cover some of the most common multiple testing correction methods. In this post I will try to give you a simple and practical explanation of multiple testing....
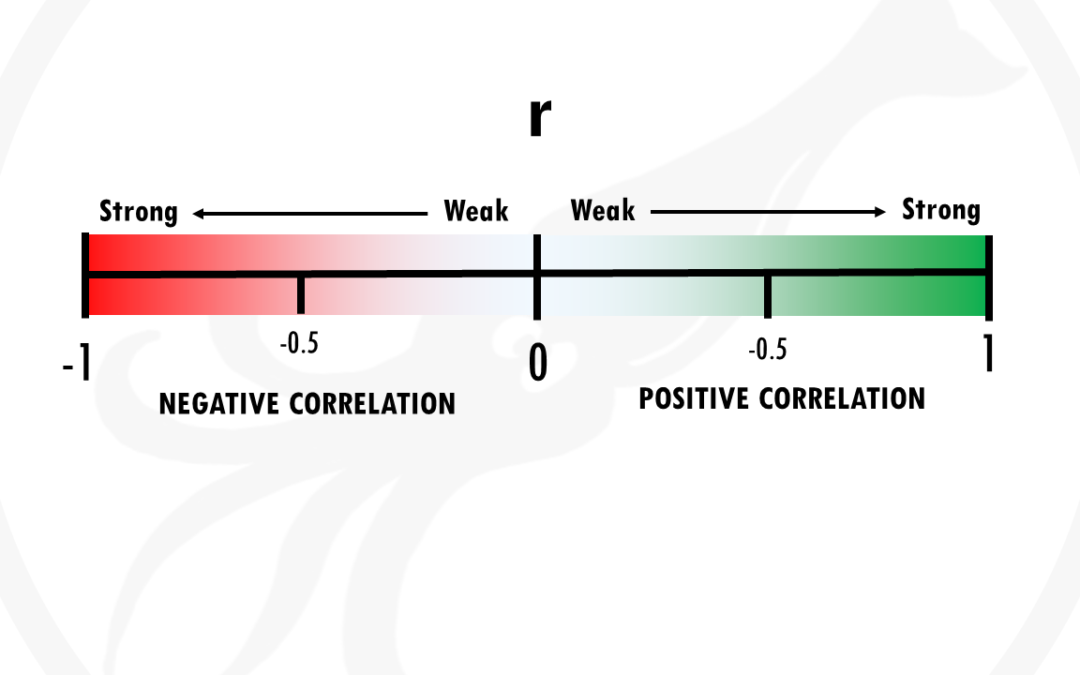
by Biostatsquid | Nov 21, 2022 | Learning, Statistics
Simple explanation of what is correlation, positive and negative correlation, and the correlation coefficient r. In this post I will try to give you a simple and practical explanation of correlation. Correlation is one of the most used statistical techniques. However,...
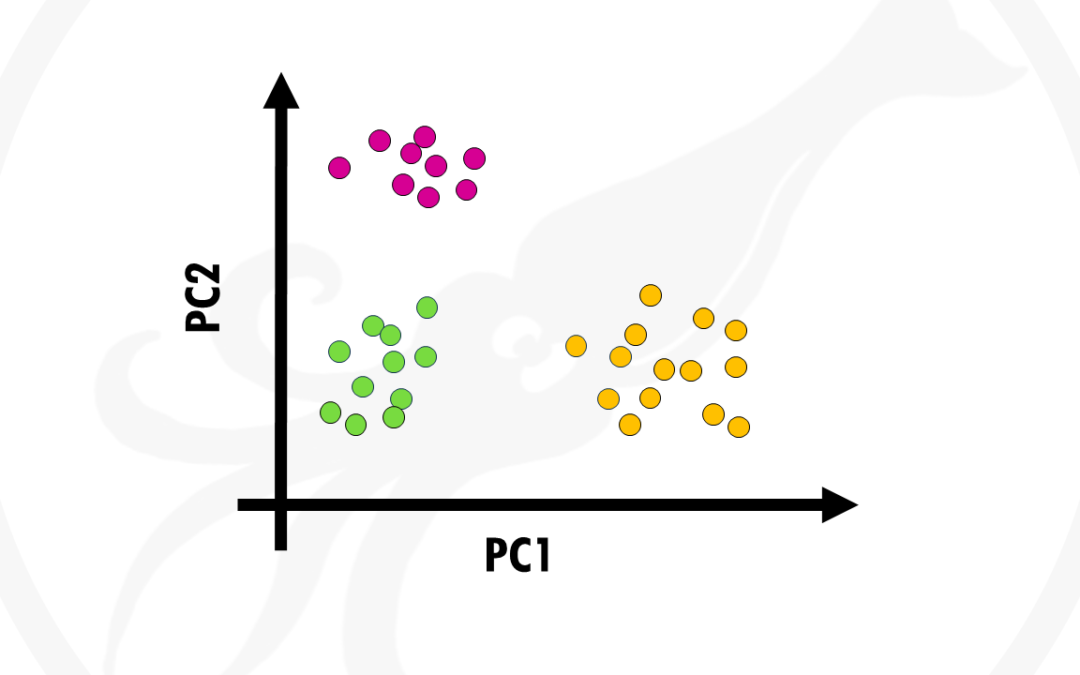
by Biostatsquid | Nov 12, 2022 | Learning, Machine learning, Statistics
In this post I will try to give you a simple and practical explanation on what is Principal Component Analysis and how to use it to visualise your biological data. Principal Component Analysis, or PCA, is a widely used technique to visualise multidimensional datasets....
by Biostatsquid | Nov 8, 2022 | Tutorials, Visualisation
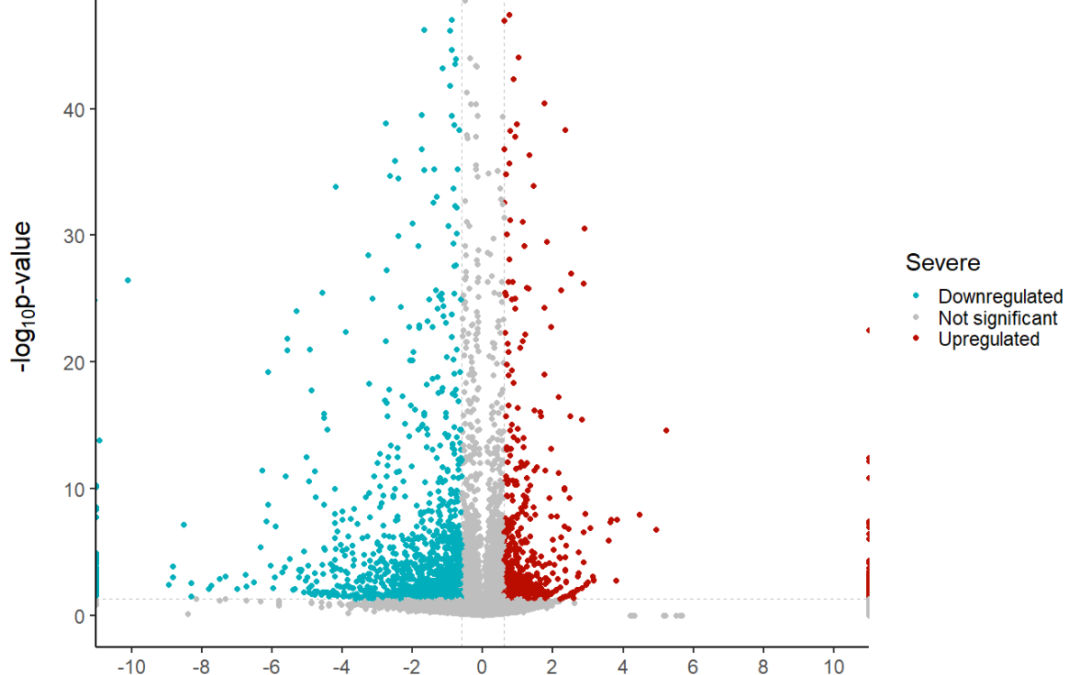
R TUTORIAL: Create your own volcano plot in R in 5 simple steps Table of contents 5 Before you start 5 Volcano plots in R: complete script 5 Step-by-step guide to create your volcano plot 9 Step 1: Set up your script 9 Step 2: Get the data ready 9 Step 3: Create a...

 This work is licensed under
CC BY-NC-SA 4.0
.
This work is licensed under
CC BY-NC-SA 4.0
.