by Biostatsquid | Mar 18, 2025 | Learning, scRNAseq, Statistics
Understanding similarities and differences between dimensionality reduction algorithms: PCA, t-SNE and UMAP PCA, t-SNE, UMAP… you’ve probably heard about all these dimensionality reduction methods. In this series of blogposts, we’ll cover the...

by Biostatsquid | Mar 14, 2025 | Learning, scRNAseq, Statistics
A short but simple explanation of UMAP- easily explained with an example! PCA, t-SNE, UMAP… you’ve probably heard about all these dimensionality reduction methods. In this series of blogposts, we’ll cover the similarities and differences between...
by Biostatsquid | Mar 6, 2025 | Learning, Machine learning, RNAseq, scRNAseq, Statistics
A short but simple explanation of t-SNE – easily explained with an example! PCA, t-SNE, UMAP… you’ve probably heard about all these dimensionality reduction methods. In this series of blogposts, we’ll cover the similarities and differences...
by Biostatsquid | Feb 28, 2025 | Machine learning, scRNAseq, Statistics
A short but simple explanation of PCA – easily explained with an example! PCA, t-SNE, UMAP… you’ve probably heard about all these dimensionality reduction methods. In this series of blogposts, we’ll cover the similarities and differences...

by Biostatsquid | Apr 12, 2023 | Learning, RNAseq, scRNAseq, Statistics
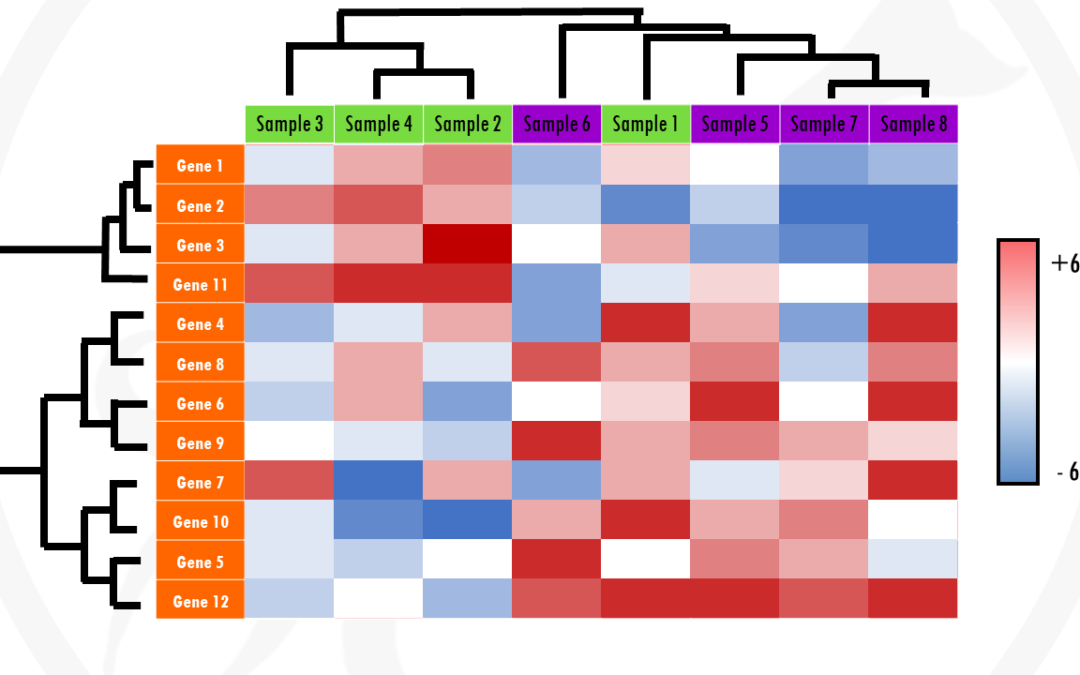
In this post, you will learn how to interpret a heatmap for differential gene expression analysis. Find out why heatmaps are a great way of visualising gene expression data with this simple explanation. Let’s dive in! Prefer to listen? Watch my Youtube video on...

by Biostatsquid | Jan 23, 2023 | Learning, RNAseq, scRNAseq, Statistics
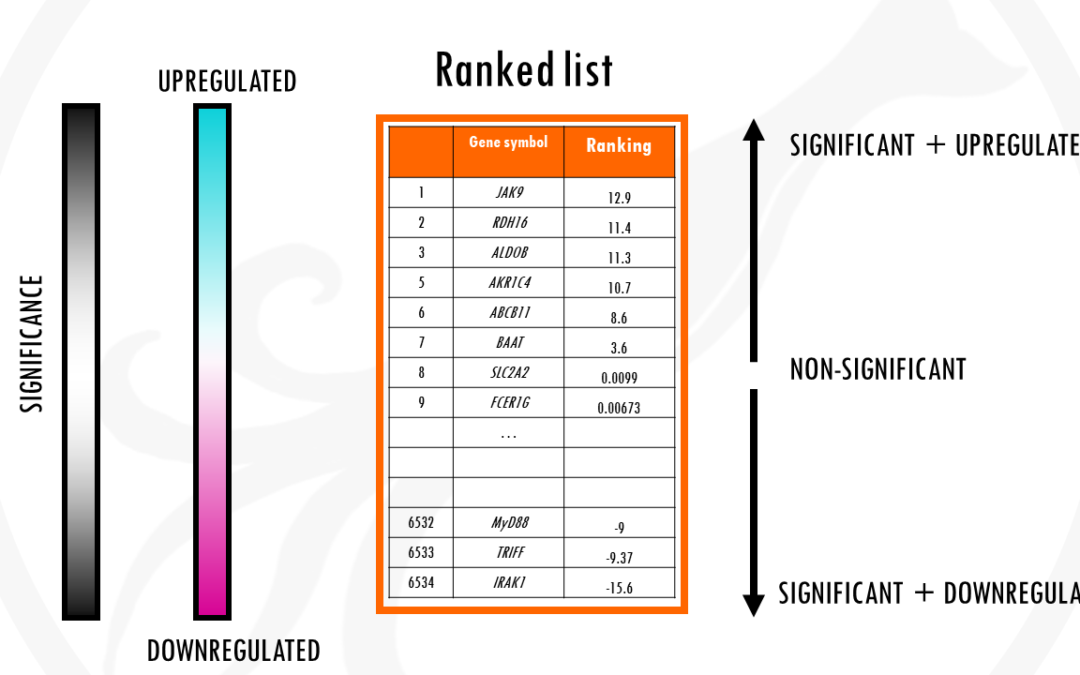
What is gene set enrichment analysis and how can you use it to summarise your differential gene expression analysis results? This post will give you a simple and practical explanation of Gene Set Enrichment Analysis, or GSEA for short. You will find out: What is Gene...


