by Biostatsquid | Nov 6, 2025 | Statistics in R, Tutorials, Visualisation
MA plots with ggplot: easy R tutorial MA plots with ggplot: easy R tutorial In this blogpost, we will learn how to create our own MA plot with ggplot, following an easy step-by-step tutorial in R. If you haven’t yet, check out my other blogpost where I go over the...
by Biostatsquid | Nov 6, 2025 | Learning, RNAseq, Statistics
How to interpret MA plots How to interpret MA plots In this blogpost, we will go over the basics of an MA plot which is a very useful visualisation for genomics and transcriptomics data. We will go over the basics of MA plots and how to interpret them. This is the...
by Biostatsquid | Sep 21, 2025 | scRNAseq, Tutorials, Visualisation
ComplexHeatmap Tutorial: create publication-ready heatmaps in R ComplexHeatmap Tutorial: create publication-ready heatmaps in R In this easy step-by-step tutorial we will learn how to create and customise a heatmap with R package ComplexHeatmap. ComplexHeatmap is one...
by Biostatsquid | Aug 24, 2025 | Learning, Statistics
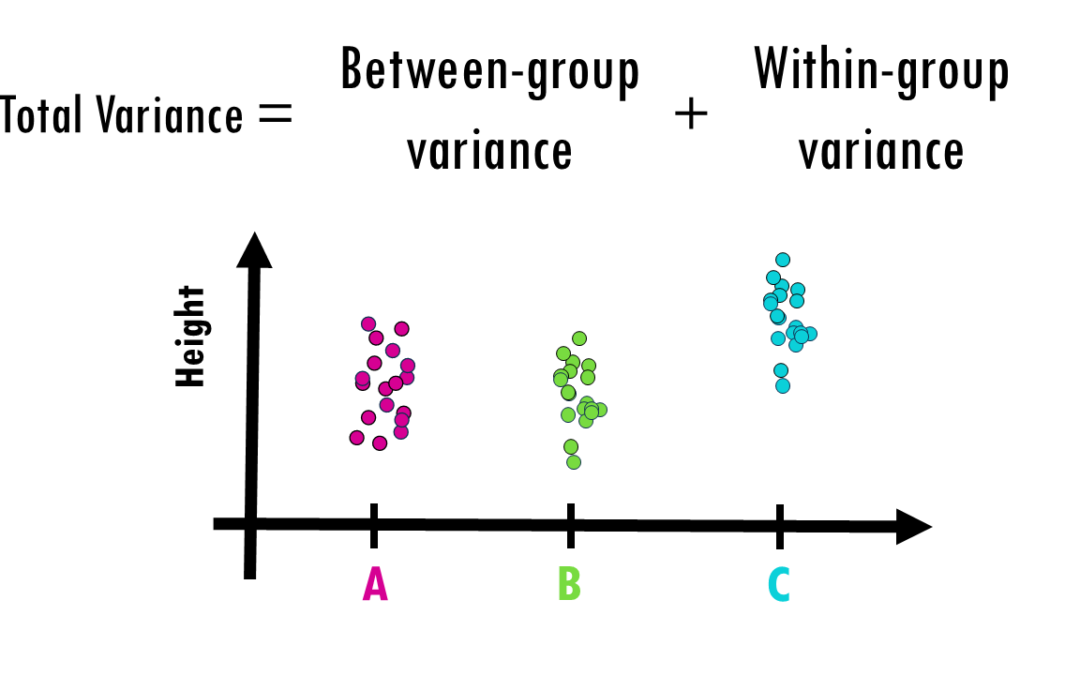
How to interpret ANOVA (analysis of variance) easily explained! When you’re working with data and want to determine whether different groups have significantly different averages, simply eyeballing the numbers won’t cut it. That’s where ANOVA (Analysis of...
by Biostatsquid | Jul 15, 2025 | RNAseq, scRNAseq, Tutorials, Uncategorized
Hey! You’re looking at an old post. Newer version here: clusterProfiler tutorial in R R TUTORIAL: Perform pathway enrichment analysis with clusterProfiler() in R Table of contents 5 Before you start 5 Step-by-step clusterProfiler tutorial 9 Step 0: Set up your...

 This work is licensed under
CC BY-NC-SA 4.0
.
This work is licensed under
CC BY-NC-SA 4.0
.