by Biostatsquid | Feb 21, 2026 | Learning, Statistics
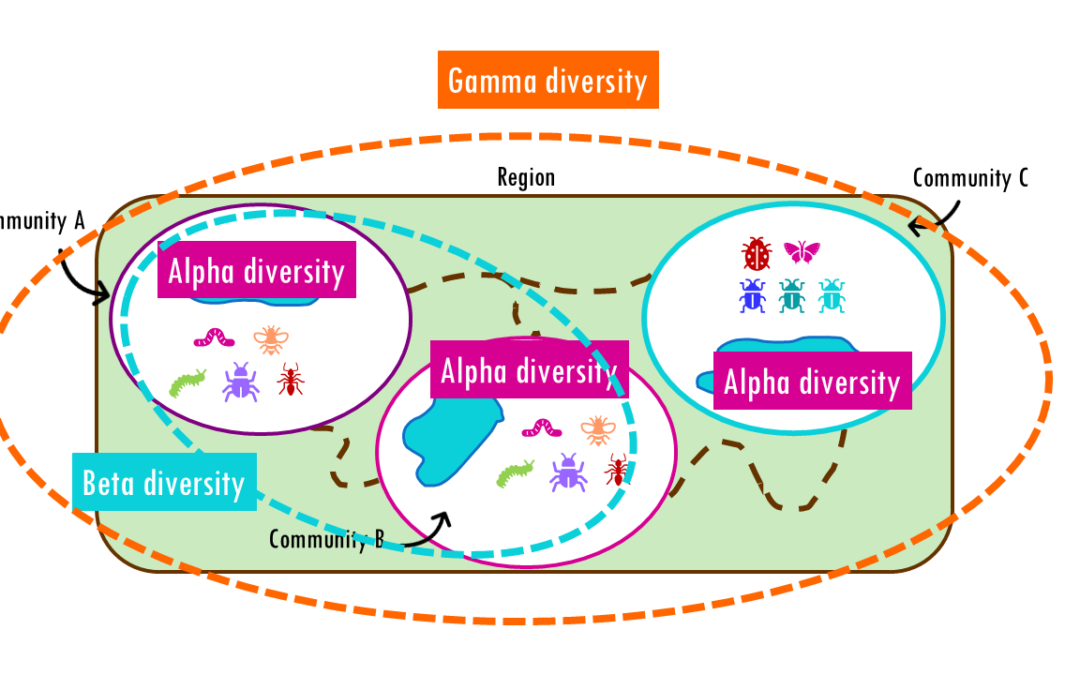
How different are communities from each other? Beta diversity easily explained! If you’ve ever hiked from a dense forest into an open grassland, you’ve probably noticed how dramatically the plants, insects, and animals can change within just a few miles. This...
by Biostatsquid | Feb 14, 2026 | Learning, Statistics
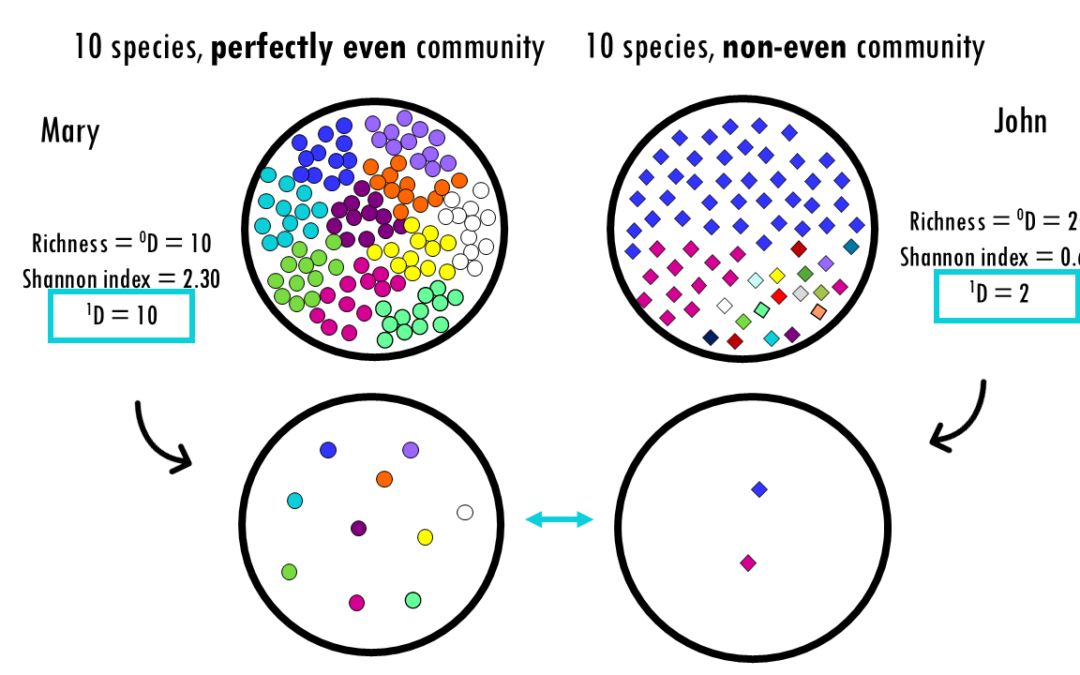
Exploring Hill numbers to compare the diversity across communities Whether you are analyzing a rainforest ecosystem, a human gut microbiome, or a B-cell receptor (BCR) repertoire, the fundamental challenge is the same: How do we accurately measure the diversity within...
by Biostatsquid | Feb 14, 2026 | Learning, Statistics
Exploring alpha diversity indices and how to interpret them: Shannon, Simpson, Gini, Chao1 and more! Whether you are analyzing a rainforest ecosystem, a human gut microbiome, or a B-cell receptor (BCR) repertoire, the fundamental challenge is the same: How do we...
by Biostatsquid | Dec 14, 2025 | Learning, scRNAseq
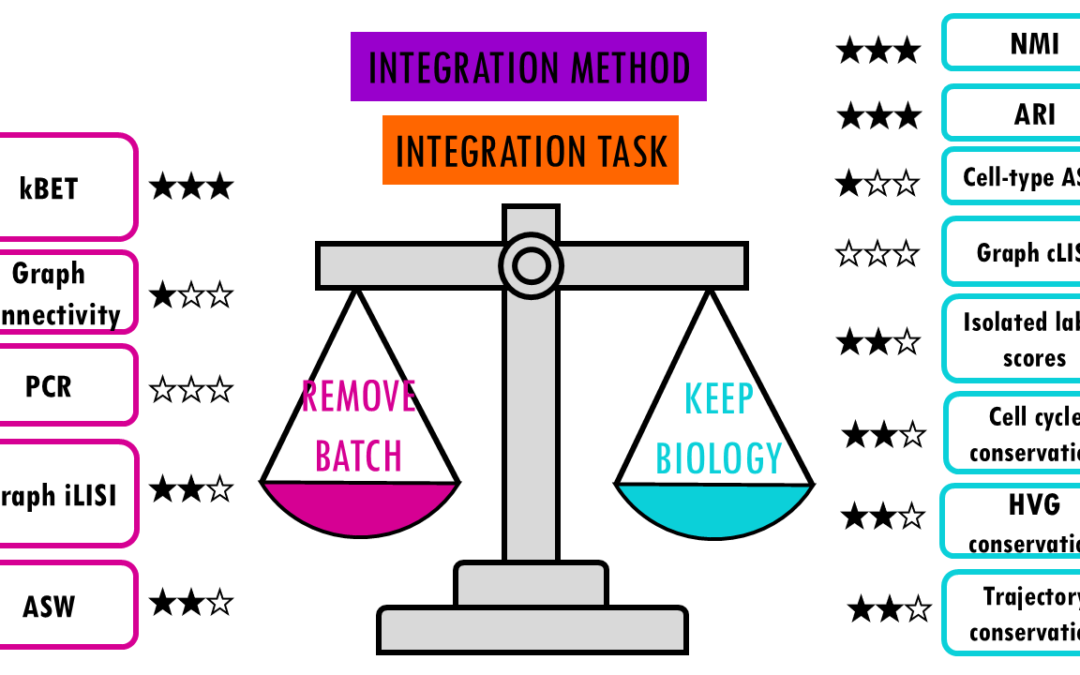
Comparing top integration methods for scRNAseq data When we want to combine multiple scRNA-seq datasets to answer bigger questions, we encounter batch effects – unwanted technical variations that arise from differences in how the experiments were performed....
by Biostatsquid | Nov 30, 2025 | Learning, scRNAseq
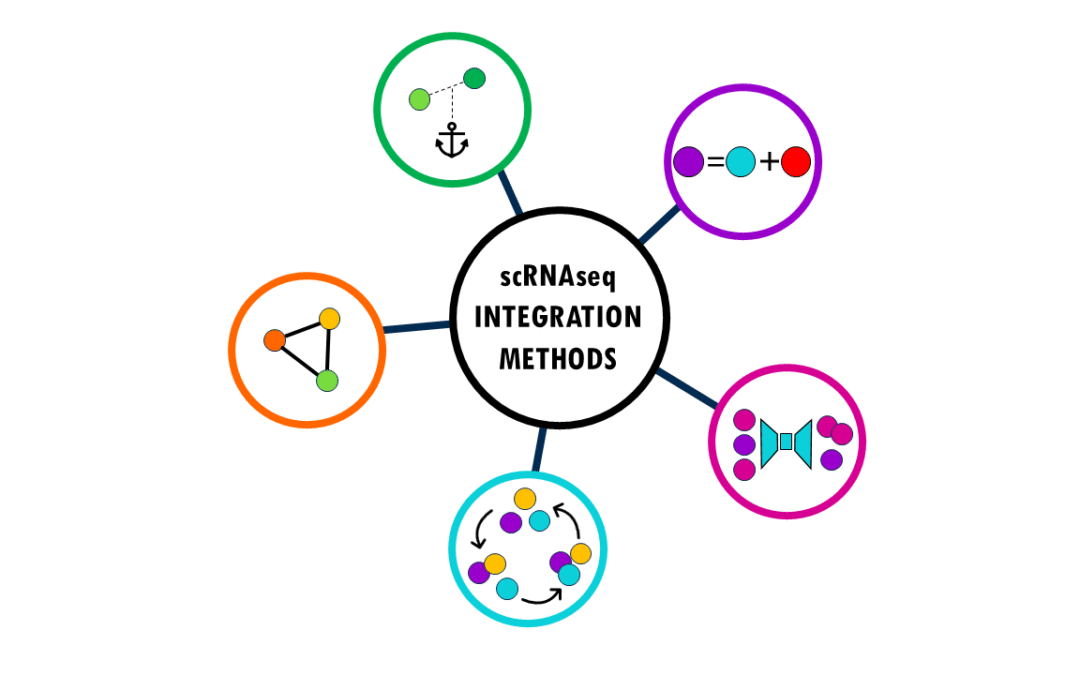
An overview of the most popular integration methods for single-cell data Single-cell RNA sequencing (scRNA-seq) has revolutionized our understanding of biology by allowing us to measure gene expression in individual cells rather than bulk tissue samples. This...
by Biostatsquid | Nov 15, 2025 | Learning, RNAseq, scRNAseq, scRNAseq, Tutorials
MSigDB gene sets: easy msigdbr in R MSigDB gene sets: easy msigdbr in R Welcome to this comprehensive guide on MSigDB (Molecular Signatures Database) and the msigdbr R package! If you’ve ever wondered which gene sets to use for your pathway enrichment analysis, or...

 This work is licensed under
CC BY-NC-SA 4.0
.
This work is licensed under
CC BY-NC-SA 4.0
.