
BiostatLEARN
Simple and clear explanations of biostatistics methods, statistical concepts and more!
I try to keep them maths-free and straight to the point, with many examples of biological applications.
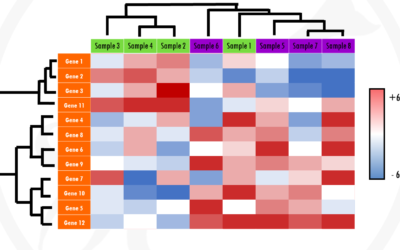
Heatmaps for gene expression analysis – simple explanation with an example
Learn how to interpret a heatmap for differential gene expression analysis. This simple explanation will give you an intuitive way to interpret heatmaps and we will apply the theory to practice by interpreting a real-life example!
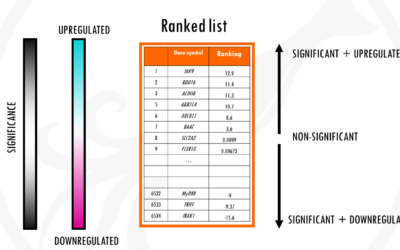
Gene Set Enrichment Analysis (GSEA) – simply explained!
An overview of Gene Set Enrichment Analysis and how to use it to summarise your differential gene expression results. The basics of GSEA simply explained!
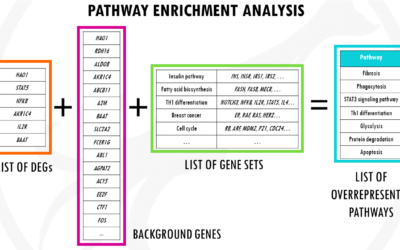
Pathway enrichment analysis for DGE – simply explained
Pathway Enrichment Analysis explained in an easy way! Find out the main idea, how it works and what do you need to summarise your differential gene expression results.
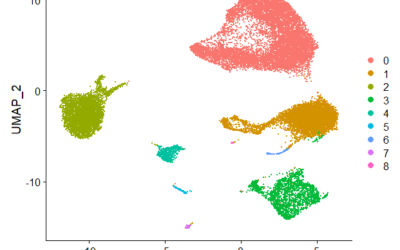
Standard scRNAseq pre-processing workflow with Seurat
Follow a step-by-step standard pipeline for scRNAseq pre-processing using the R package Seurat, including filtering, normalisation, scaling, PCA and more!
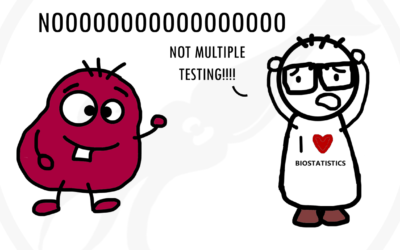
Multiple testing correction methods: FDR, q-values vs p-values
Why is multiple testing a big issue in biostatistics? Find out what is multiple testing and the most common correction methods: Bonferroni correction, Benjamini-Hochberg (BH) and q-values.
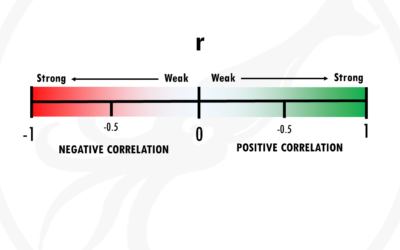
Correlation does not imply causation
What does ‘correlation does not imply causation’ mean? Correlation vs causation. A simple explanation of what is correlation, how to know if two variables are correlated, positive and negative correlation and the correlation coefficient r.
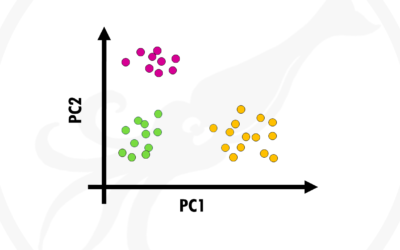
Principal Component Analysis (PCA) simply explained
A simple and practical explanation of Principal Component Analysis or PCA and how to use it to interpret biological data.
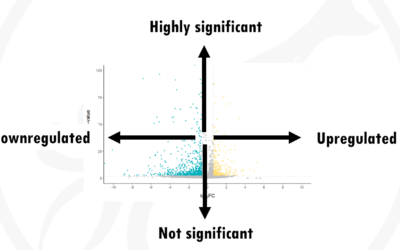
How to interpret a volcano plot
How to interpret a volcano plot, simply explained! Learn how to read anduse volcano plots to show your gene expression results.