by Biostatsquid | Feb 21, 2026 | Learning, Statistics
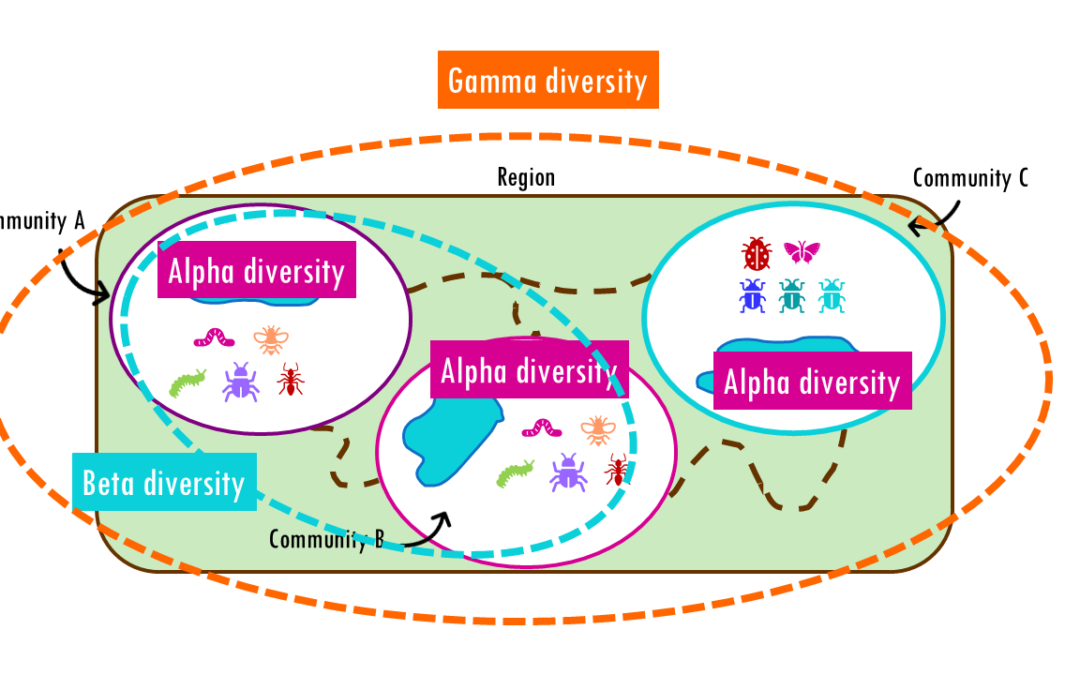
How different are communities from each other? Beta diversity easily explained! If you’ve ever hiked from a dense forest into an open grassland, you’ve probably noticed how dramatically the plants, insects, and animals can change within just a few miles. This...
by Biostatsquid | Feb 14, 2026 | Learning, Statistics
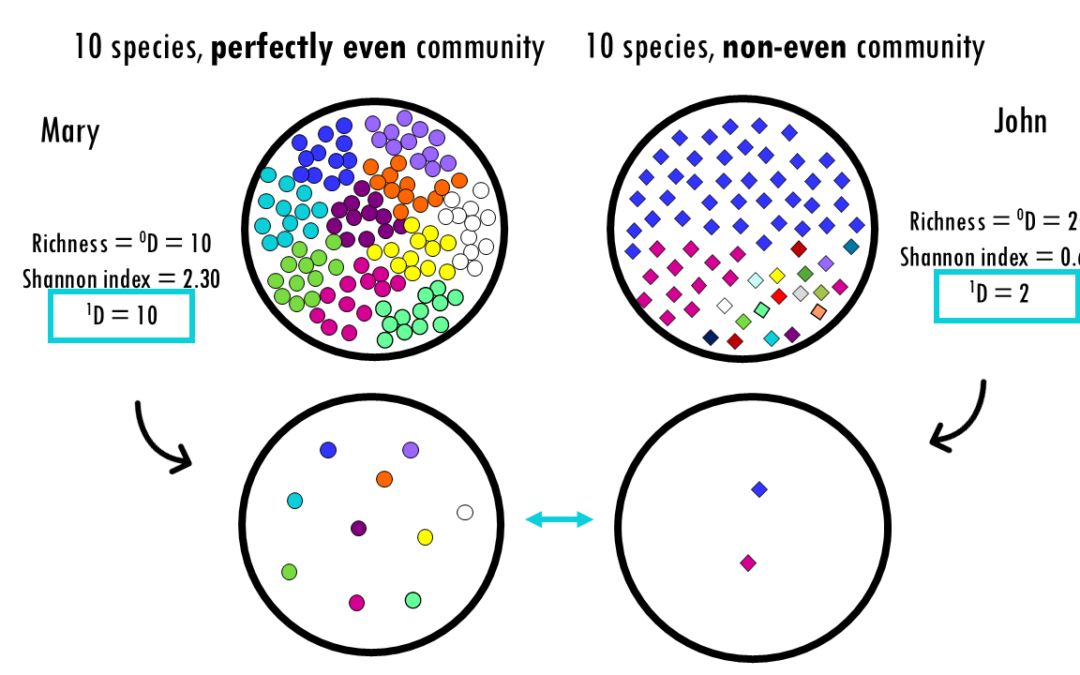
Exploring Hill numbers to compare the diversity across communities Whether you are analyzing a rainforest ecosystem, a human gut microbiome, or a B-cell receptor (BCR) repertoire, the fundamental challenge is the same: How do we accurately measure the diversity within...
by Biostatsquid | Feb 14, 2026 | Learning, Statistics
Exploring alpha diversity indices and how to interpret them: Shannon, Simpson, Gini, Chao1 and more! Whether you are analyzing a rainforest ecosystem, a human gut microbiome, or a B-cell receptor (BCR) repertoire, the fundamental challenge is the same: How do we...
by Biostatsquid | Nov 6, 2025 | Learning, RNAseq, Statistics
How to interpret MA plots How to interpret MA plots In this blogpost, we will go over the basics of an MA plot which is a very useful visualisation for genomics and transcriptomics data. We will go over the basics of MA plots and how to interpret them. This is the...
by Biostatsquid | Aug 24, 2025 | Learning, Statistics
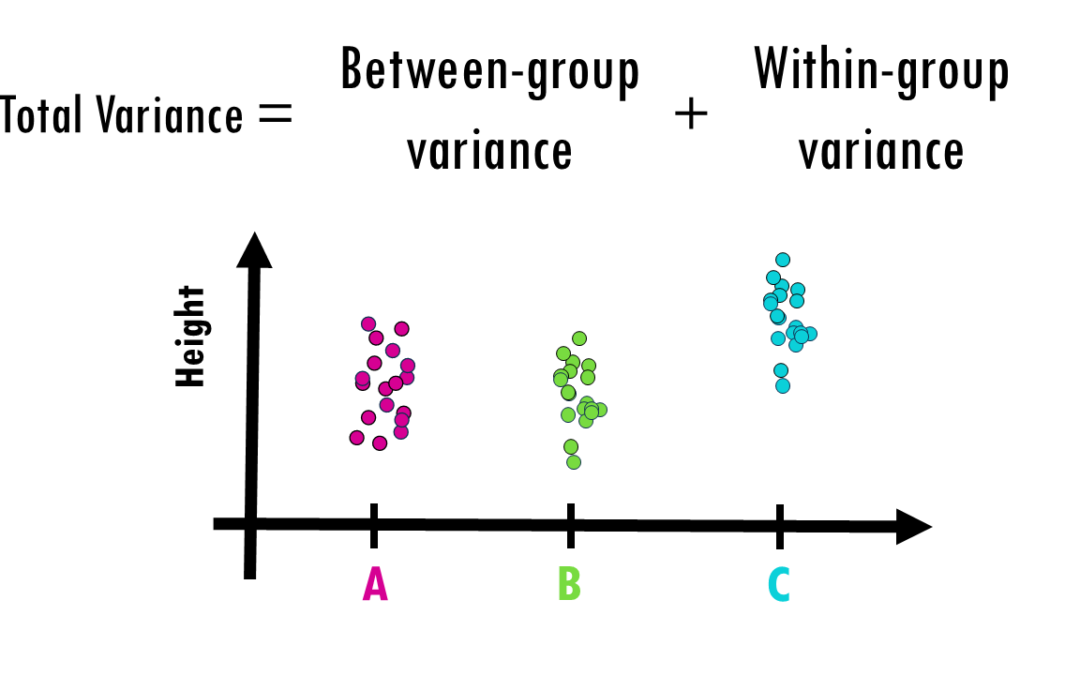
How to interpret ANOVA (analysis of variance) easily explained! When you’re working with data and want to determine whether different groups have significantly different averages, simply eyeballing the numbers won’t cut it. That’s where ANOVA (Analysis of...
by Biostatsquid | Jun 24, 2025 | Statistics
Setting thresholds for differential gene expression (DGE) analysis is crucial and depends on several factors. In essence, for a list of genes, we are trying to define what counts as biologically meaningful versus just statistically significant. The question is…...

 This work is licensed under
CC BY-NC-SA 4.0
.
This work is licensed under
CC BY-NC-SA 4.0
.