biostatsquid.com
  • BiostatSQUID
  • BiostatLEARN
  • BiostatCODE
  • BiostatTOOLS
  • FAQ
  • Contact
  • About me
Select Page
Pathway enrichment analysis for DGE – simply explained

Pathway enrichment analysis for DGE – simply explained

by Biostatsquid | Jan 23, 2023 | Learning, RNAseq, scRNAseq, Statistics

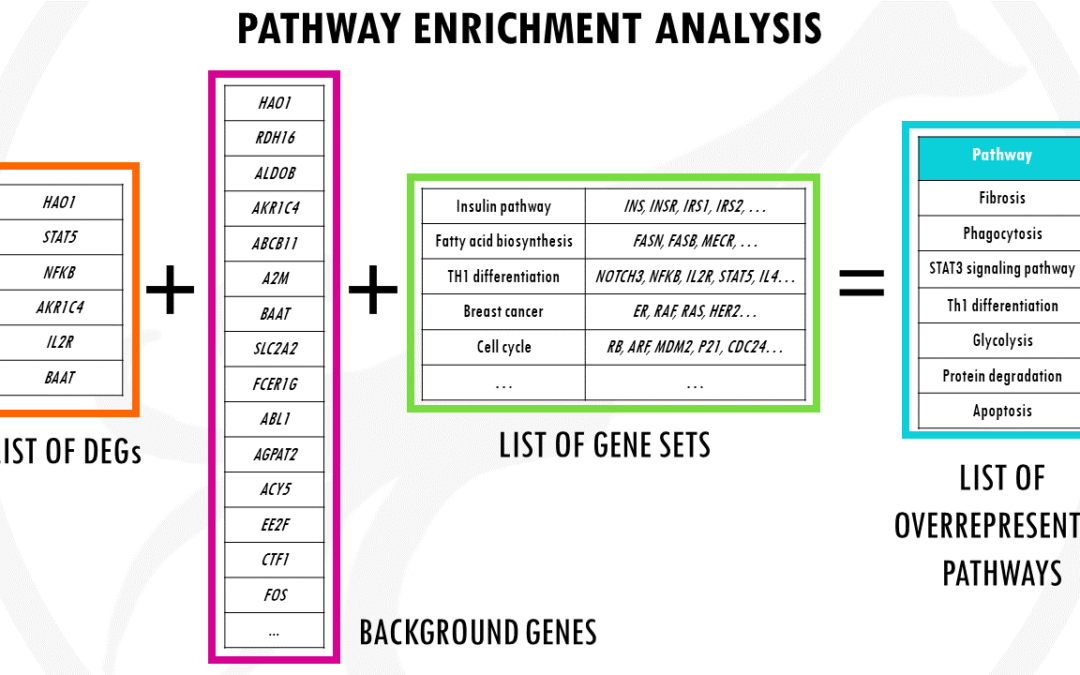
An overview of pathway enrichment analysis and how you can use it for your differential gene expression analysis data. In this post, you will find pathway enrichment analysis explained in a simple way with examples. I will try to give you a simple and practical...
Next Entries »
  • YouTube
  • GitHub
  • Instagram
  • LinkedIn
If you’d like to support my work or say thanks…

Buy Me a Coffee

Popular Posts

  • Easy R tutorial: pathway enrichment analysis plots
  • How to interpret MA plots
  • Kaplan-Meier curve – easily explained!
  • Easy survival analysis in R
  • How to choose log2FC thresholds for DGE analysis

Recent posts

  • Hill numbers and diversity profiles simply explained
  • Diversity metrics simply explained: Shannon, Simpson, Chao1
  • Which is the best scRNAseq integration method?
  • Integration methods in scRNAseq: easily explained!
  • MSigDB gene sets: easy msigdbr in R
CC License
Creative Commons License This work is licensed under CC BY-NC-SA 4.0 .
      • BiostatSQUID
      • BiostatLEARN
      • BiostatCODE
      • BiostatTOOLS
      • FAQ
      • Contact
      • About me

      All original blog posts, articles, and written content by Laura Twomey are licensed under Creative Commons Attribution-NonCommercial-ShareAlike 4.0 International License. Third-party images, photographs, and external materials are excluded and remain under their original copyright.