by Biostatsquid | Nov 6, 2025 | Statistics in R, Tutorials, Visualisation
MA plots with ggplot: easy R tutorial MA plots with ggplot: easy R tutorial In this blogpost, we will learn how to create our own MA plot with ggplot, following an easy step-by-step tutorial in R. If you haven’t yet, check out my other blogpost where I go over the...
by Biostatsquid | Sep 21, 2025 | scRNAseq, Tutorials, Visualisation
ComplexHeatmap Tutorial: create publication-ready heatmaps in R ComplexHeatmap Tutorial: create publication-ready heatmaps in R In this easy step-by-step tutorial we will learn how to create and customise a heatmap with R package ComplexHeatmap. ComplexHeatmap is one...
by Biostatsquid | Jun 20, 2024 | Tutorials, Visualisation
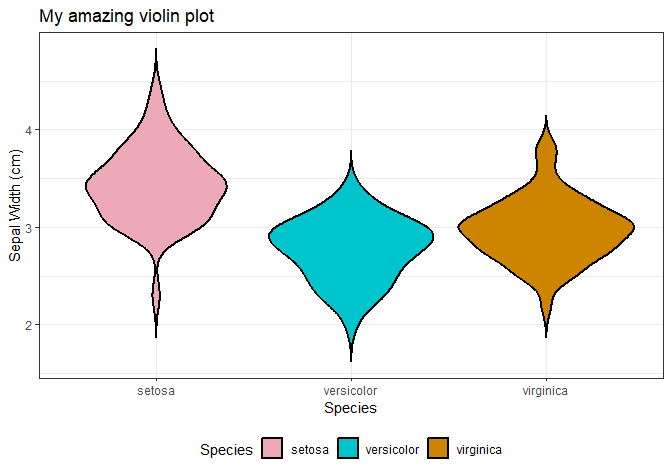
A step-by-step easy R tutorial to create and customise violin plots with ggplot2 In this easy, step-by-step tutorial you will learn how to create your own violin plots in R, including how to customise the colours, layout, create grouped violin plots, and more! If you...
by Biostatsquid | Nov 16, 2023 | Tutorials, Visualisation
In this post, I will show you how to use italics in plots in R. This is very useful when you want to display gene names or species names correctly. You can easily customise your text in R plots to include italics, bold and more! To show you how you can italicize text...
by Biostatsquid | Oct 1, 2023 | Tutorials, Visualisation
Find out some of the best tricks and tips for visualisation in R! Having cool results is one thing, but being able to show those results is another. Choosing the right plot and making it attractive is just as important to get your message across clearly. In this post,...
by Biostatsquid | May 20, 2023 | Tutorials, Visualisation
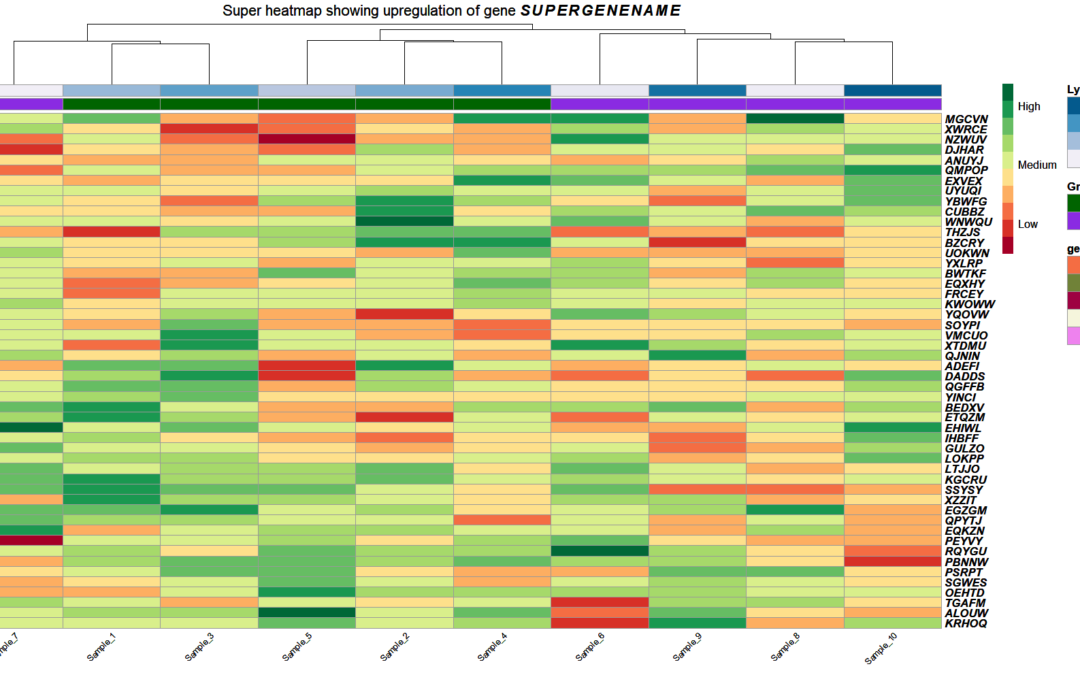
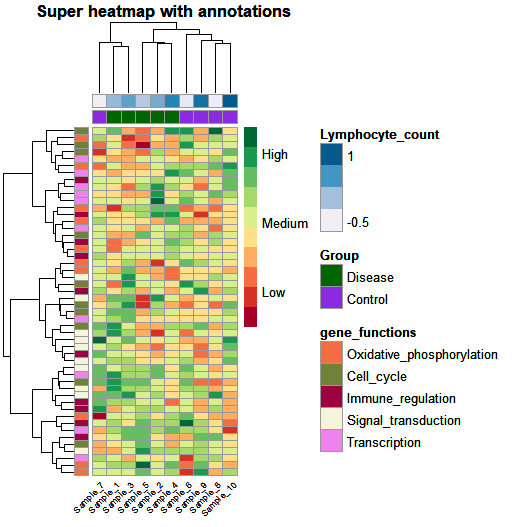
R TUTORIAL: Follow this step-by-step heatmap tutorial with pheatmap() to visualise your differential gene expression results in R Table of contents 5 Before you start 5 Heatmaps with pheatmap(): complete script 5 Step-by-step guide to create annotated heatmaps in R 9...

 This work is licensed under
CC BY-NC-SA 4.0
.
This work is licensed under
CC BY-NC-SA 4.0
.