by Biostatsquid | May 20, 2023 | Tutorials, Visualisation
R TUTORIAL: Follow this step-by-step heatmap tutorial with pheatmap() to visualise your differential gene expression results in R Table of contents 5 Before you start 5 Heatmaps with pheatmap(): complete script 5 Step-by-step guide to create annotated heatmaps in R 9...

by Biostatsquid | Feb 8, 2023 | Tutorials
R TUTORIAL: From .fastq to .bam, preprocess and align your sequencing reads with this step-by-step sequencing reads R tutorial Table of contents 5 Before you start 5 Sequencing reads processing pipeline: complete script 5 Step-by-step guide for sequencing read...

by Biostatsquid | Jan 10, 2023 | scRNAseq, Tutorials
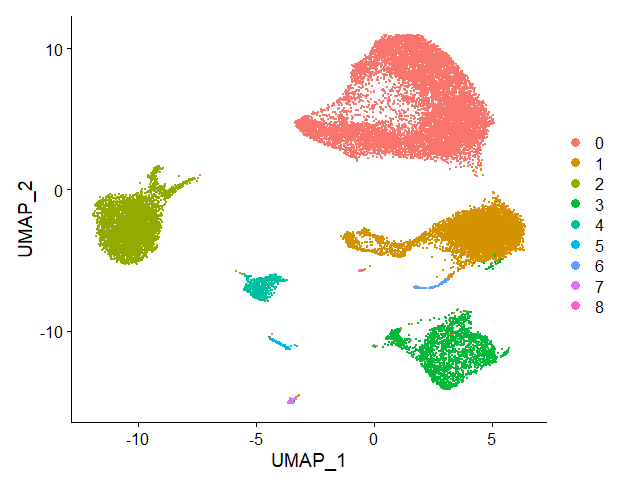
R TUTORIAL: Pre-process your scRNAseq data with this easy, step-by-step pipeline Table of contents 5 Before you start 5 scRNAseq pre-processing pipeline: complete script 5 Step-by-step guide to analyse your data with Seurat 9 Step 1: Set up your script 9 Step 2:...

by Biostatsquid | Nov 8, 2022 | Tutorials, Visualisation
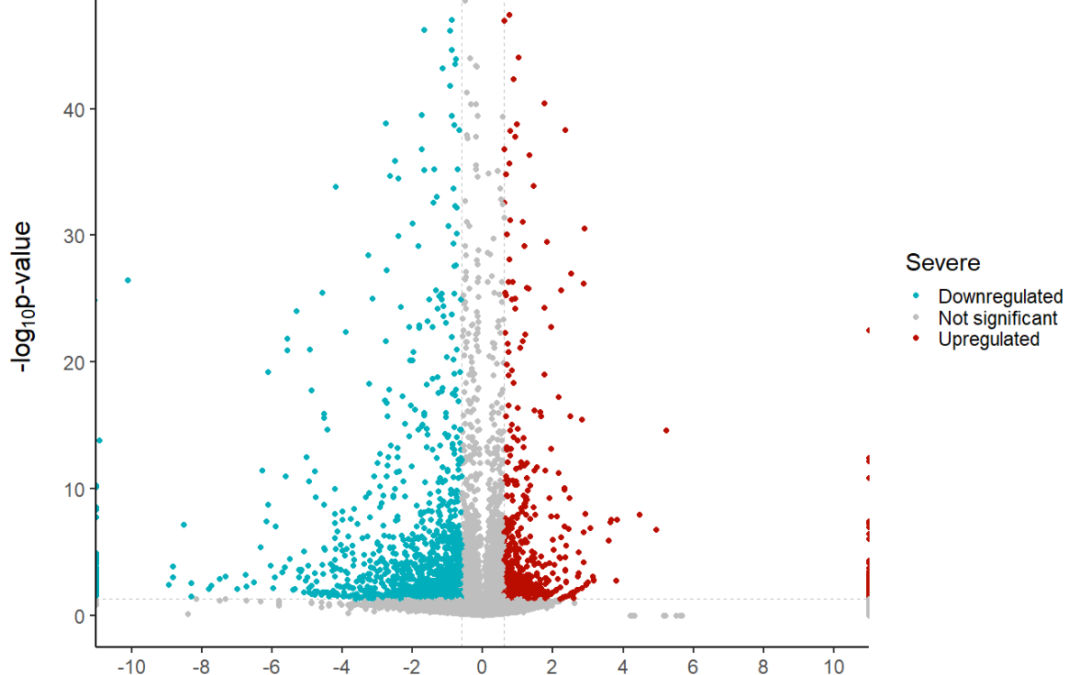
R TUTORIAL: Create your own volcano plot in R in 5 simple steps Table of contents 5 Before you start 5 Volcano plots in R: complete script 5 Step-by-step guide to create your volcano plot 9 Step 1: Set up your script 9 Step 2: Get the data ready 9 Step 3: Create a...


