
by Biostatsquid | May 5, 2025 | scRNAseq, Tutorials
A step-by-step easy R tutorial to preprocess scRNAseq data with Seurat v5 In this easy, step-by-step tutorial you will learn how a Seurat object is structured and how to preprocess scRNAseq data using the standard workflow with Seurat v5. This is a hands-on...
by Biostatsquid | Aug 25, 2024 | scRNAseq, Tutorials
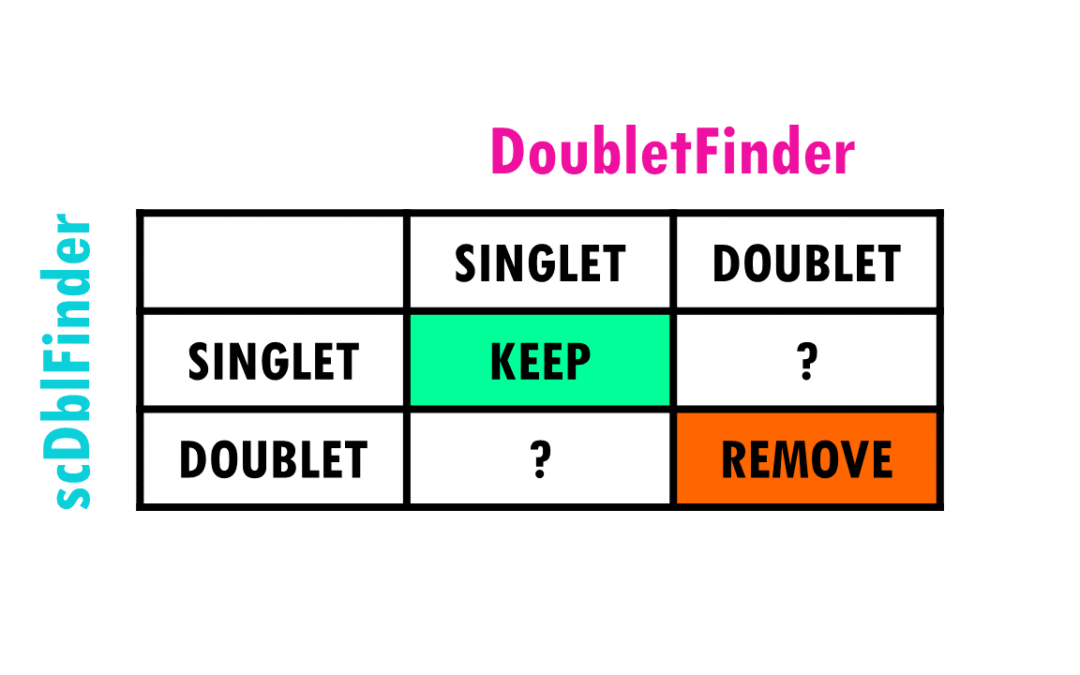
A step-by-step easy R tutorial to detect and remove doublets from scRNAseq data In this easy, step-by-step tutorial you will learn how to do some general doublet QC and remove doublets from our Seurat object in R for scRNAseq data. This is part 3 of my tutorial series...
by Biostatsquid | Aug 18, 2024 | scRNAseq, Tutorials
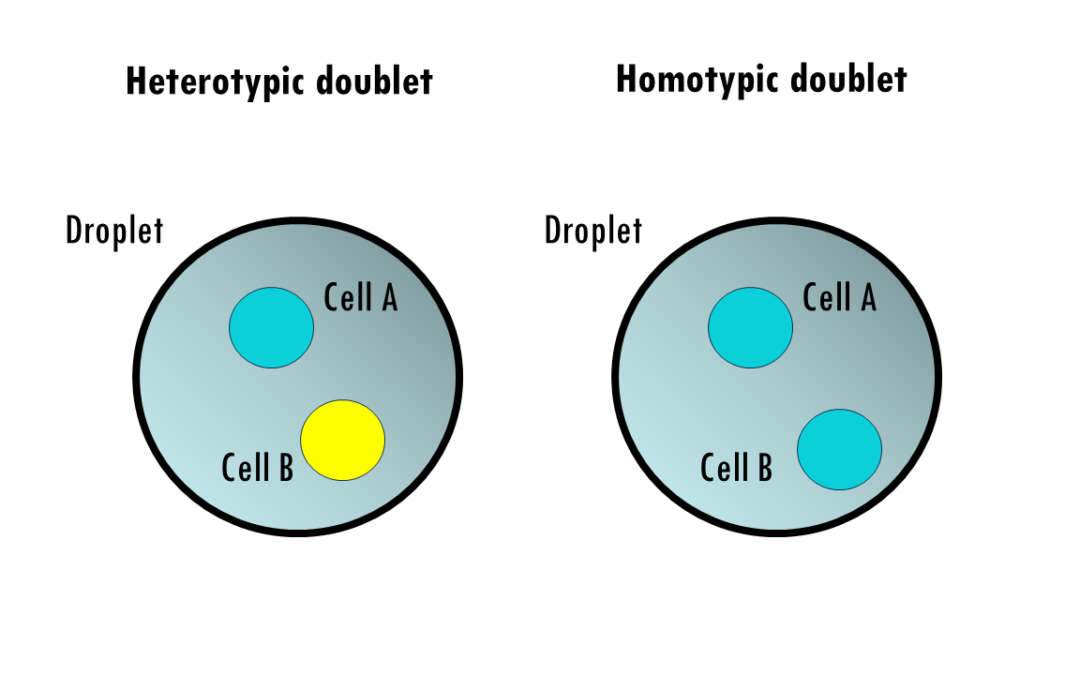
A step-by-step easy R tutorial to detect and remove doublets using DoubletFinder in R In this easy, step-by-step tutorial you will learn how to detect and remove doublets from scRNAseq data in R, using the R package DoubletFinder. First things first. What are...
by Biostatsquid | Aug 18, 2024 | scRNAseq, Tutorials
A step-by-step easy R tutorial to detect and remove doublets using scDblFinder in R In this easy, step-by-step scDblFinder tutorial you will learn how to detect and remove doublets from scRNAseq data in R, using the R package (you guessed it!) scDblFinder . First...
by Biostatsquid | Jun 20, 2024 | Tutorials, Visualisation
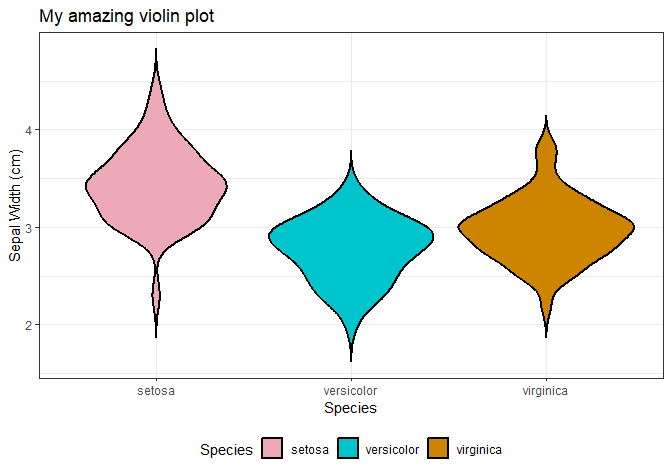
A step-by-step easy R tutorial to create and customise violin plots with ggplot2 In this easy, step-by-step tutorial you will learn how to create your own violin plots in R, including how to customise the colours, layout, create grouped violin plots, and more! If you...

by Biostatsquid | Mar 11, 2024 | scRNAseq, Tutorials
A step-by-step easy R tutorial for cell type annotation with SingleR In this easy, step-by-step tutorial you will learn how to to do cell type annotation with the R package SingleR. SingleR is a popular reference-based automatic cell type annotation tool used to...

 This work is licensed under
CC BY-NC-SA 4.0
.
This work is licensed under
CC BY-NC-SA 4.0
.