
BiostatLEARN
Simple and clear explanations of biostatistics methods, statistical concepts and more!
I try to keep them maths-free and straight to the point, with many examples of biological applications.
Latest posts
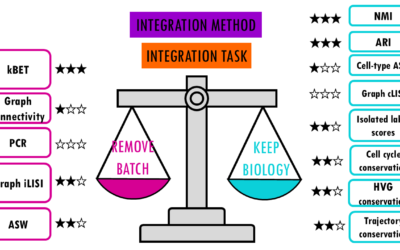
Which is the best scRNAseq integration method?
Comparing top integration methods for scRNAseq dataWhen we want to combine multiple scRNA-seq datasets to answer bigger questions, we encounter batch effects - unwanted technical variations that arise from differences in how the experiments were performed. These batch...
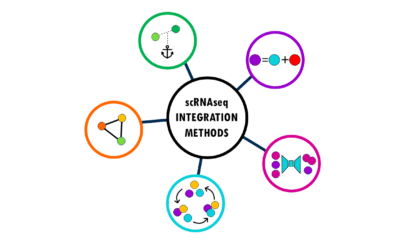
Integration methods in scRNAseq: easily explained!
An overview of the most popular integration methods for single-cell dataSingle-cell RNA sequencing (scRNA-seq) has revolutionized our understanding of biology by allowing us to measure gene expression in individual cells rather than bulk tissue samples. This...
MSigDB gene sets: easy msigdbr in R
MSigDB gene sets: easy msigdbr in R MSigDB gene sets: easy msigdbr in R Welcome to this comprehensive guide on MSigDB (Molecular Signatures Database) and the msigdbr R package! If you’ve ever wondered which gene sets to use for your pathway enrichment analysis, or...
How to interpret MA plots
How to interpret MA plots How to interpret MA plots In this blogpost, we will go over the basics of an MA plot which is a very useful visualisation for genomics and transcriptomics data. We will go over the basics of MA plots and how to interpret them. This is the...
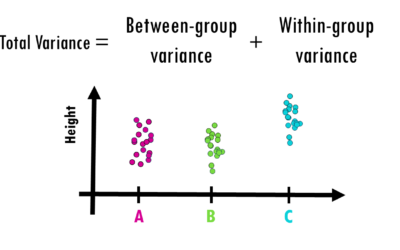
ANOVA (analysis of variance) easily explained
How to interpret ANOVA (analysis of variance) easily explained!When you're working with data and want to determine whether different groups have significantly different averages, simply eyeballing the numbers won’t cut it. That’s where ANOVA (Analysis of Variance)...
Pathway Enrichment Analysis with clusterProfiler (old version)
Hey! You're looking at an old post. Newer version here: clusterProfiler tutorial in RR TUTORIAL: Perform pathway enrichment analysis with clusterProfiler() in RBefore you start...Welcome to Biostatsquid's easy and step-by-step tutorial on ClusterProfiler! In this...
scRNAseq
Statistics and machine learning
RNAseq
A simple explanation of PCA
A short but simple explanation of PCA - easily explained with an example!PCA, t-SNE, UMAP... you've probably heard about all these dimensionality reduction methods. In this series of blogposts, we'll cover the similarities and differences between them, easily...
Heatmaps for gene expression analysis – simple explanation with an example
In this post, you will learn how to interpret a heatmap for differential gene expression analysis. Find out why heatmaps are a great way of visualising gene expression data with this simple explanation. Let's dive in!Prefer to listen? Watch my Youtube video on...
Gene Set Enrichment Analysis (GSEA) – simply explained!
What is gene set enrichment analysis and how can you use it to summarise your differential gene expression analysis results?This post will give you a simple and practical explanation of Gene Set Enrichment Analysis, or GSEA for short. You will find out: What is Gene...
Pathway enrichment analysis for DGE – simply explained
An overview of pathway enrichment analysis and how you can use it for your differential gene expression analysis data. In this post, you will find pathway enrichment analysis explained in a simple way with examples. I will try to give you a simple and practical...
Why do genes with the highest logFC not have the lowest p-value?
That's a really good and very common question in differential gene expression analysis! It feels intuitive that the larger the difference in expression (log fold change, or logFC), the more significant it should be (i.e., the smaller the p-value), but that’s not...
PCA vs UMAP vs t-SNE
Understanding similarities and differences between dimensionality reduction algorithms: PCA, t-SNE and UMAPPCA, t-SNE, UMAP... you've probably heard about all these dimensionality reduction methods. In this series of blogposts, we'll cover the similarities and...
Easy UMAP – explained with an example
A short but simple explanation of UMAP- easily explained with an example!PCA, t-SNE, UMAP... you've probably heard about all these dimensionality reduction methods. In this series of blogposts, we'll cover the similarities and differences between them, easily...
Easy t-SNE – explained with an example
A short but simple explanation of t-SNE - easily explained with an example!PCA, t-SNE, UMAP... you've probably heard about all these dimensionality reduction methods. In this series of blogposts, we'll cover the similarities and differences between them, easily...
A simple explanation of PCA
A short but simple explanation of PCA - easily explained with an example!PCA, t-SNE, UMAP... you've probably heard about all these dimensionality reduction methods. In this series of blogposts, we'll cover the similarities and differences between them, easily...
How to interpret boxplots and violin plots
A short but simple explanation of boxplots and violin plots - easily explained with an example!Violin plots and boxplots are a great way to visualise and compare a continuous variable across different groups or categories. For example, you might want to find out which...
How to interpret density plots
A short but simple explanation of density plots - easily explained with an example!Density plots are a great way to visualise the distribution of continuous variables. For example, you might want to find out within which range of weights most of your mice fall. Or if...
Logistic regression – easily explained!
A short but simple explanation of logistic regression - easily explained with an example!Logistic regression is a statistical model (also known as logit model) which is often used for classification and predictive analytics. But what is logistic regression? When do we...
Easy Cox regression for survival analysis
A simple explanation of Cox regression and hazard ratios for survival time analysisSurvival time analysis studies a variable with a start time and an end time, which is when a certain event occurs. The event could be death, but also be relapse after chemotherapy, a...
Easy log rank test for survival analysis
A simple explanation of the log rank test to evaluate differences between survival curvesPreviously, we talked about survival analysis and the Kaplan-Meier curve. In this post, I will explain how to interpret the log rank test for survival analysis. Before we start,...
No Results Found
The page you requested could not be found. Try refining your search, or use the navigation above to locate the post.