What is gene set enrichment analysis and how can you use it to summarise your differential gene expression analysis results?
This post will give you a simple and practical explanation of Gene Set Enrichment Analysis, or GSEA for short.
You will find out:
-
- What is Gene Set Enrichment Analysis (GSEA) and how does it differ from other Pathway Enrichment Analysis methods
- What do you need to perform GSEA
- The main idea behind all GSEA algorithms
- How to interpret GSEA results
If you are more of a video-based learner, you can check out my Youtube video, otherwise, just keep reading!
Let’s dive in!
Check out my Youtube video to learn the basics of GSEA!
What is GSEA?
Before we explain Gene Set Enrichment Analysis, you need to be familiar with Pathway Enrichment Analysis (PEA) methods.
In this other post, you can read more about PEA.
I will give you a quick recap.
Pathway enrichment analysis methods take a list of differentially expressed (DE) genes as input, and identify the sets in which the DE genes are over-represented or under-represented.
So they basically summarise long lists of genes into a shorter list of pathways.
The significance of each pathway is measured by calculating the probability that the observed number of DE genes in a given pathway are simply observed by chance. Lower p-values means that the pathway is actually overrepresented and it was not just by chance.
These approaches are known as Over-Representation Analysis (ORA).
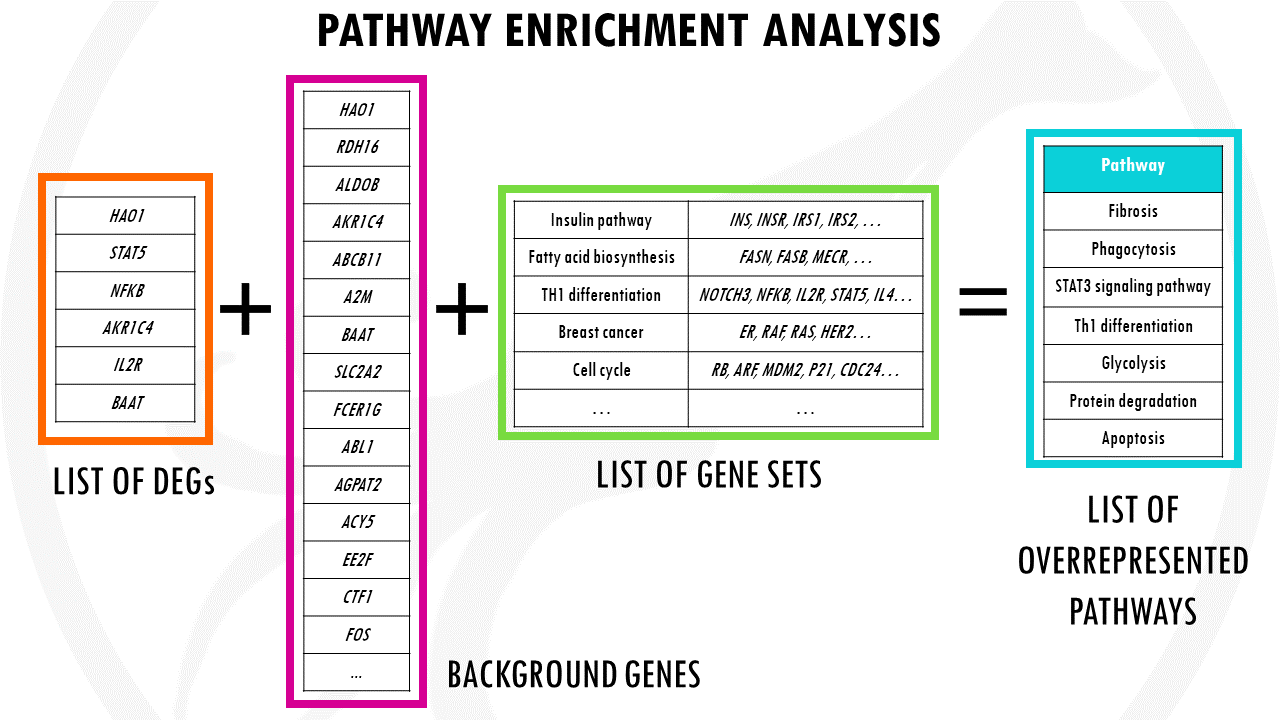
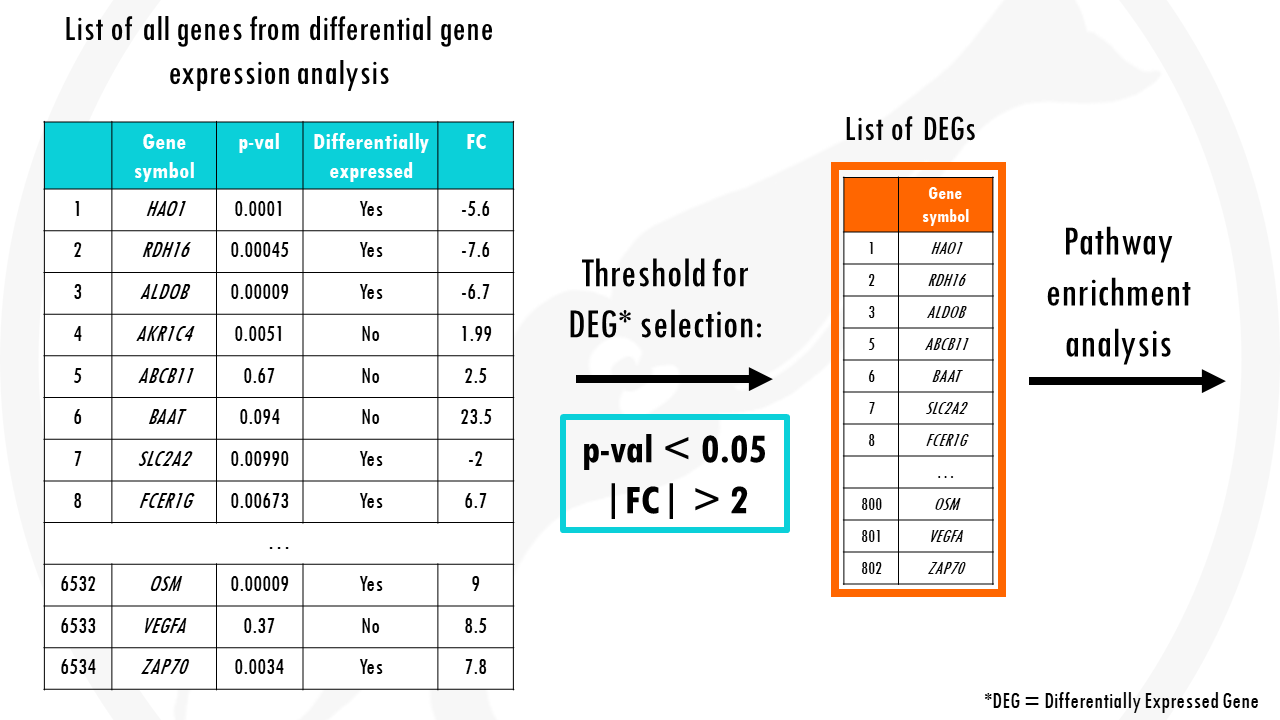
The problem in overrepresentation analysis methods is that we first need to select differentially expressed genes.
Traditionally, we use thresholds of fold change > +2 or < -2, and p-value < 0.05.
But what if a gene has a fold change of 1.99 and p value of 0.051?
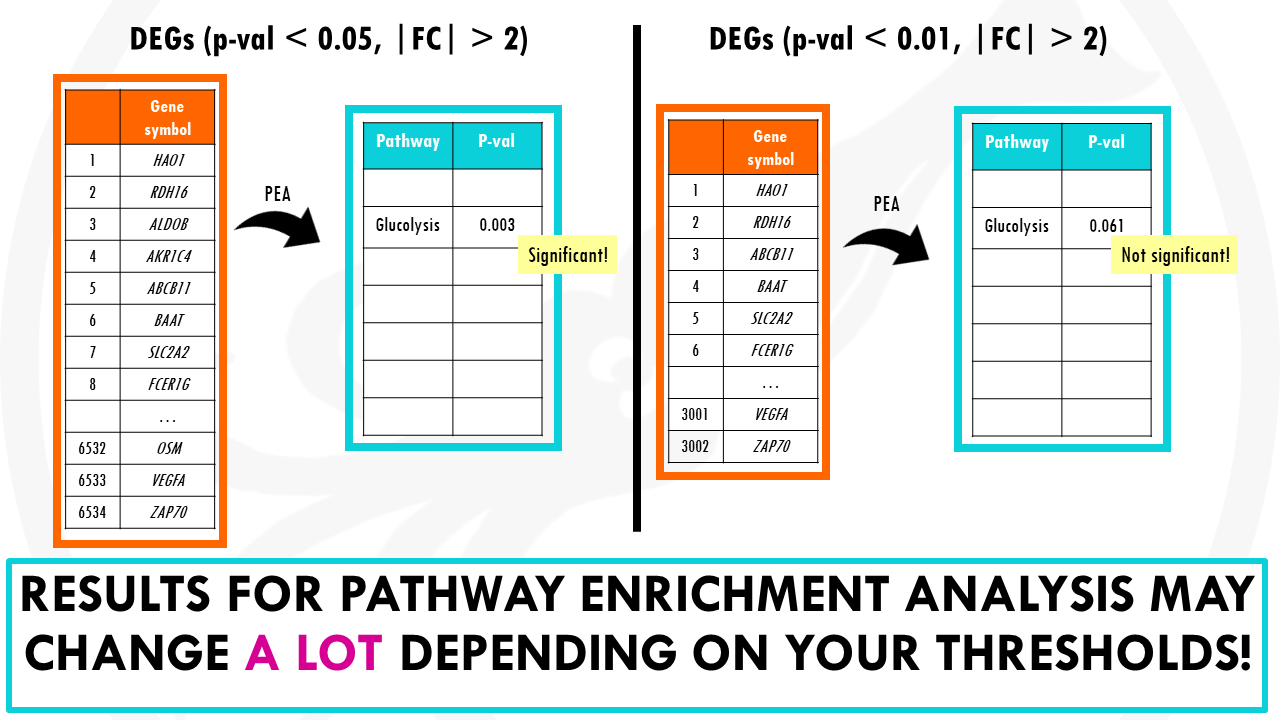
They are still important genes to consider, and by removing them they can modify the results from over representation analysis a lot.
And it is especially bad if you have few differentially expressed genes to start with.
So the issue with overrepresentation analysis methods is that the results depend a lot in our criteria.
In one sentence,
Overrepresentation Analysis Methods depend a lot in the criteria used to select differentially-expressed genes.
To solve this problem, a second generation of methods was designed.
They are called Functional Class Scoring methods (FCS).
How did they eliminate this dependency on gene selection criteria? Basically, by taking all genes into consideration.
But they do it smartly, because they are not only looking for significant changes in sets of functionally related genes, but also genes with large expression changes.
One of the most popular approaches is Gene set enrichment analysis, or GSEA.
How does GSEA work?
The steps to perform Gene Set Enrichment Analysis are very similar to overrepresentation analysis methods. The big difference is that the input is not a list of genes, but a ranked list genes.

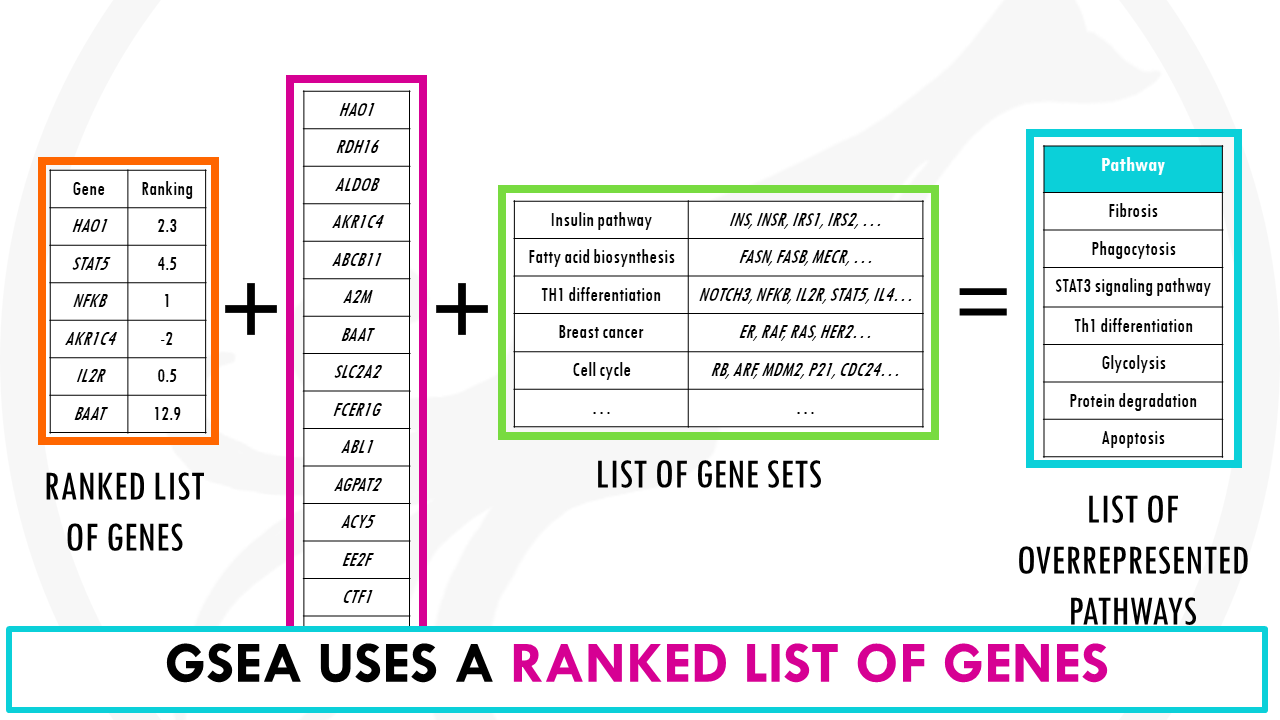
Wait a minute. Ranking genes?
This basically means that genes are ranked by some score.
A common way of ranking genes is by level of differential expression. The p-values tell us how significant the change is. The log2fold changes tell us the direction and strength of the change, basically if they are upregulated or downregulated.
We can combine both to get a ranked list of genes. This will order the genes both by significance and the direction of change.
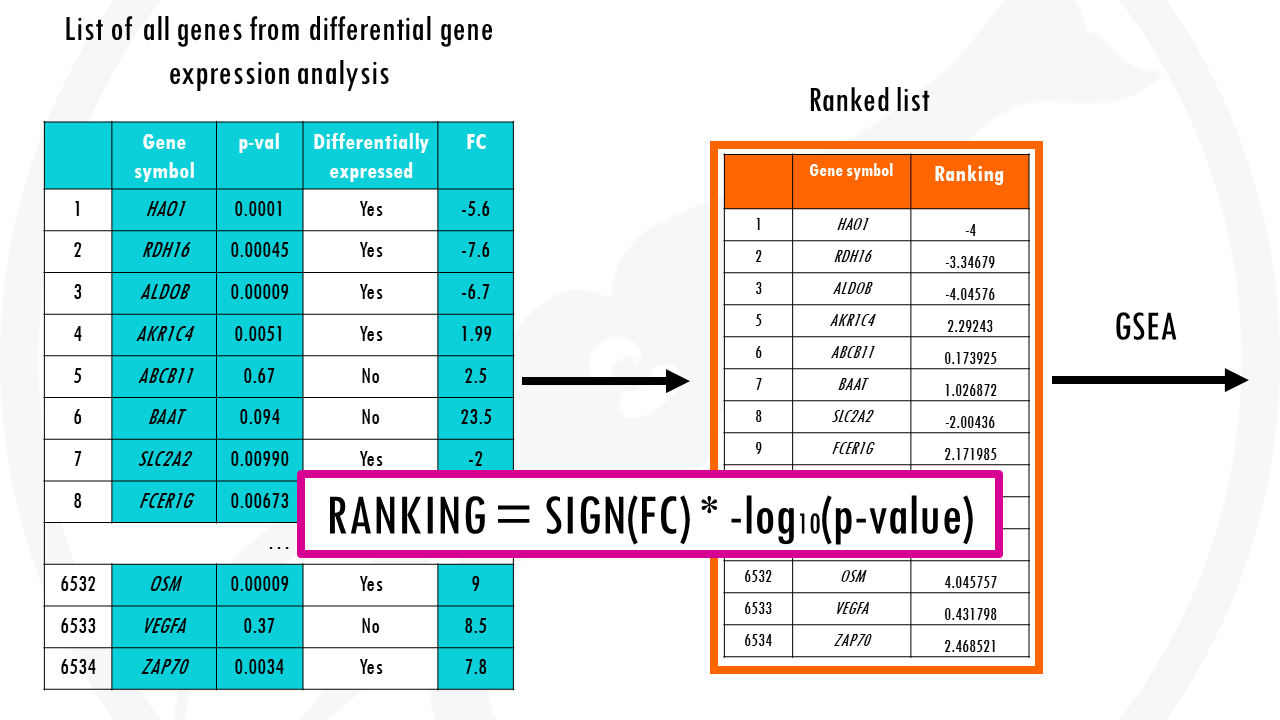
At the top of the list you’ll have the most upregulated significant genes and at the bottom the most downregulated significant genes.
So this ranked list of genes is our input.
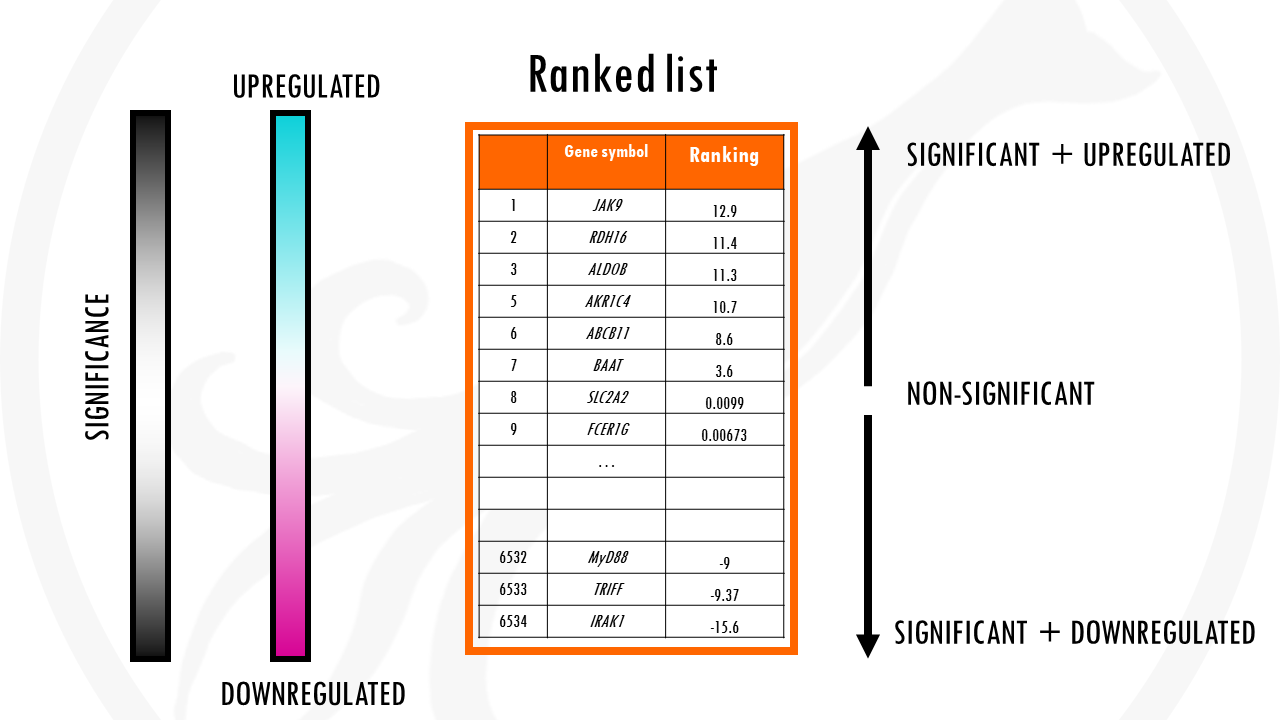
A ranked list of genes is an ordered list of genes by some metric. For example, by level of differential expression.
Then, GSEA basically checks how the genes for a specific gene set are distributed in your list.
It checks whether members of a gene set tend to occur toward the top (or bottom) of the list.
GSEA easily explained with an example
Time for an example!
Imagine we are studying the gene expression differences between liver cells of healthy liver tissue, and liver cells from alcoholic liver disease.
We compared the gene expression in alcoholic liver disease vs healthy cells.
On your left (in blue) you can see your results from differential gene expression analysis.
On your right (in orange), your ranked gene list.
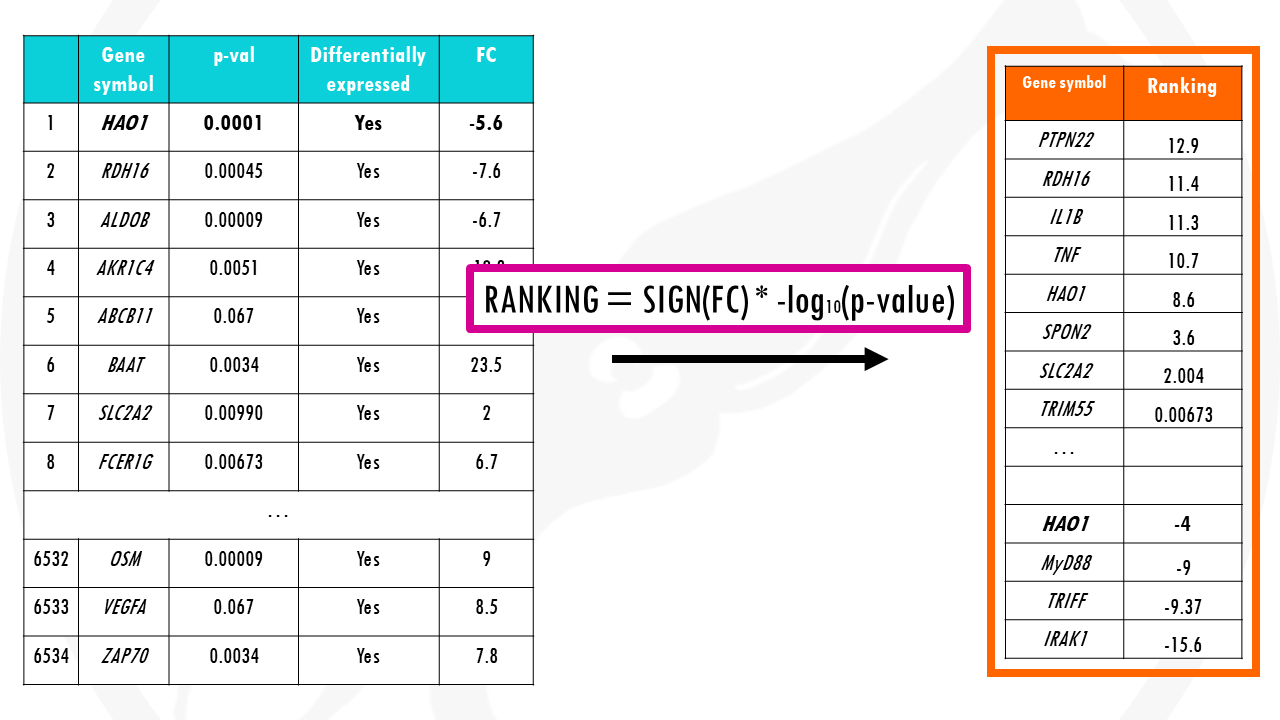
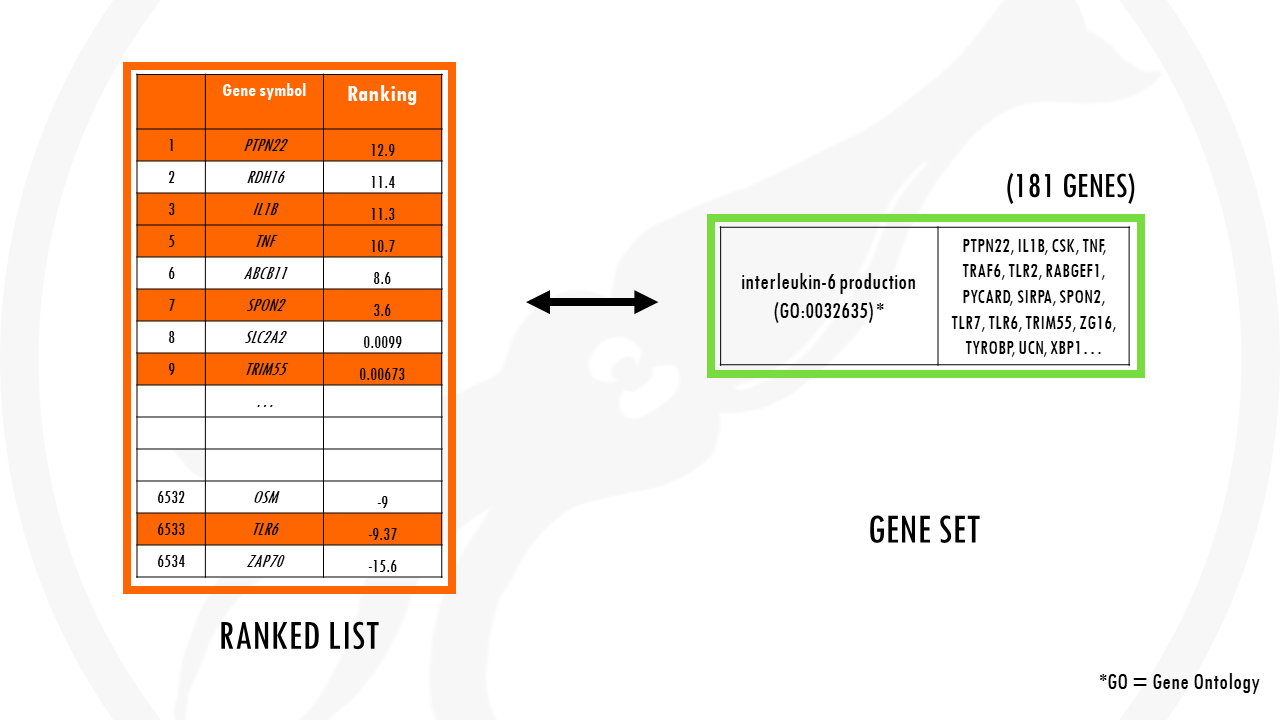
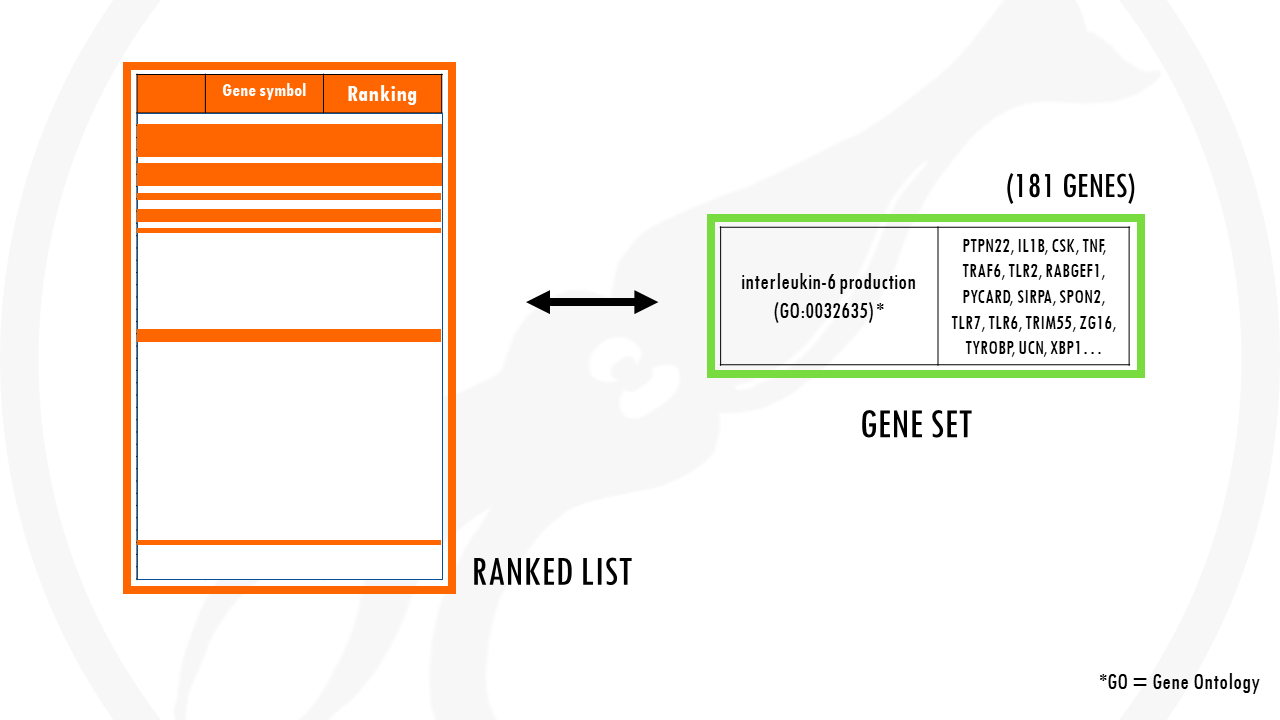
Now let’s take the gene set involved in interleukin 6 production. There are 181 genes involved in IL-6 production.
To check if IL-6 production is overrepresented in our list of genes, we basically check how it is distributed in our ranked list.

This is just a simple example. But if we had thousands of genes, it might look a bit more like this:
Did you notice a pattern?
Most genes involved in IL-6 production are at the top of the list, since most genes involved in IL-6 production pathway were upregulated in our dataset.
Remember that our ranked list means upregulated, significant genes are at the top. So upregulated pathways will have most of their genes towards the top of our list.
You can probably figure out how the distributions look if we had downregulated pathways.
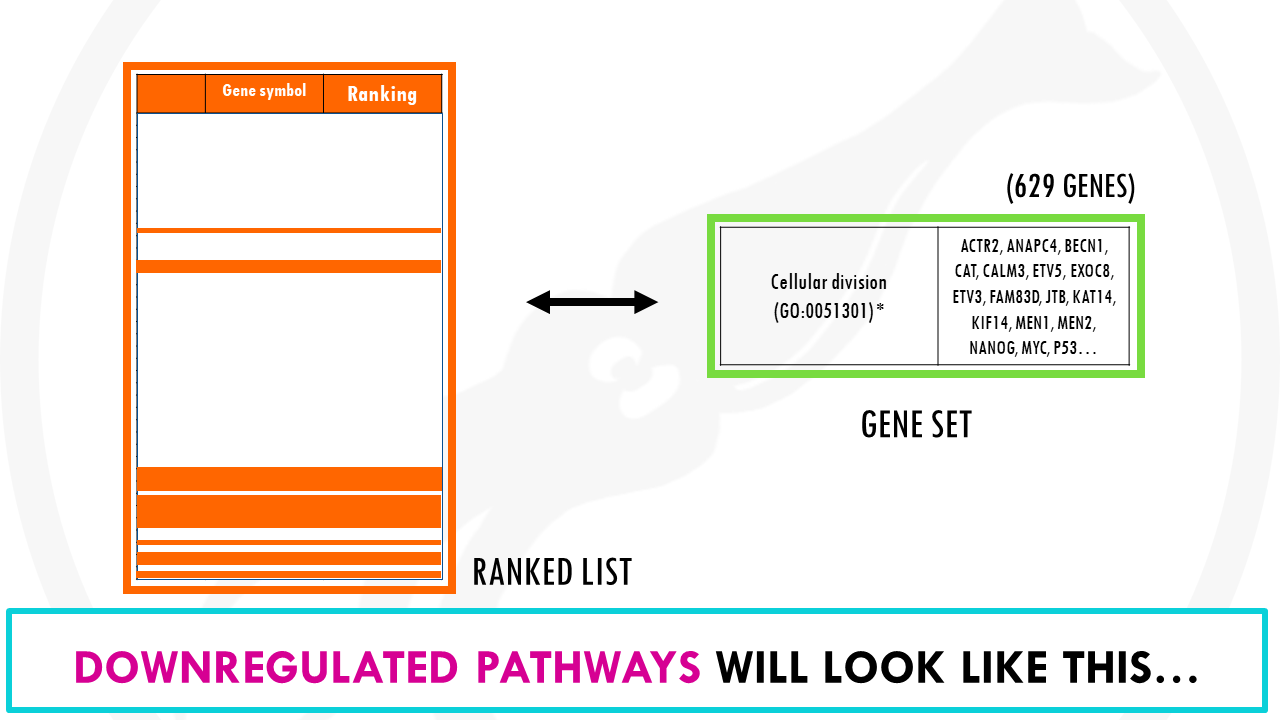
That’s right! The opposite will happen for downregulated pathways.
For example, genes involved in cellular division, which we found to be downregulated in alcoholic liver vs healthy cells, will mostly be at the bottom of the list.
What about pathways that are not overrepresented? For example, genes involved in heart contraction, will look like this, they are evenly distributed our list.
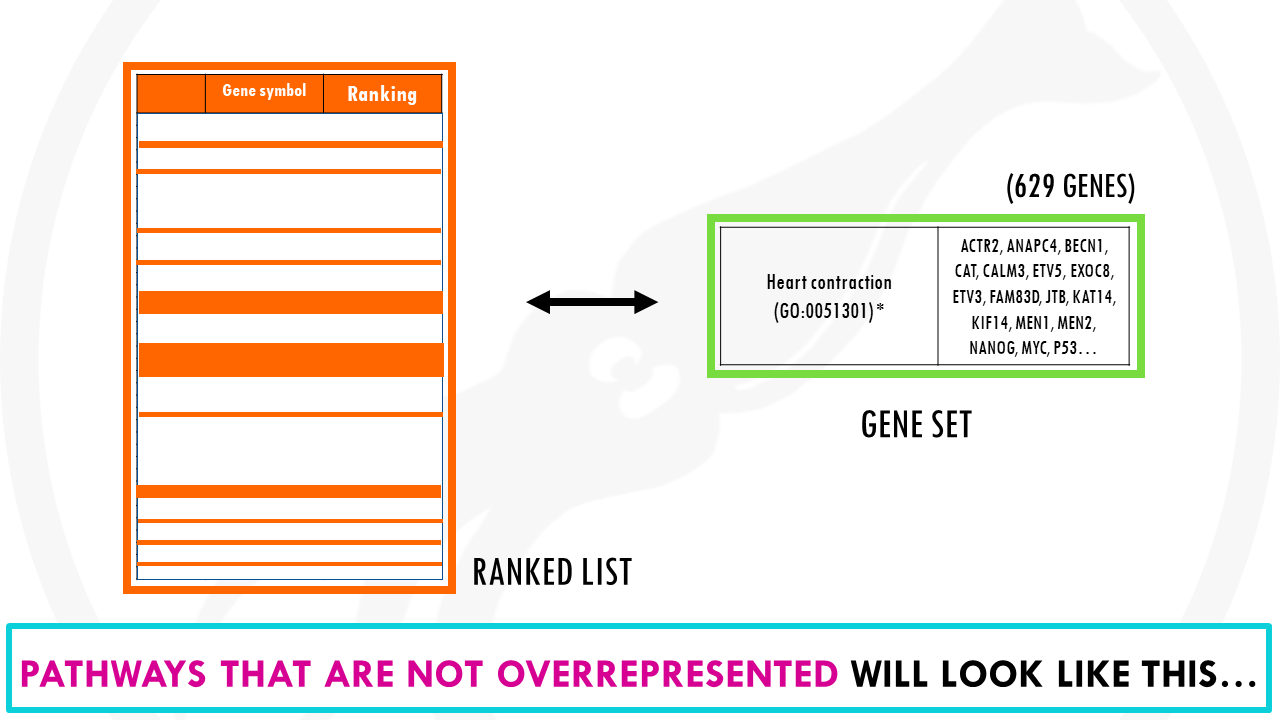
Obviously, we need a proper statistical test to identify which pathways show a non-random distribution across this sorted list.
The most often used is the Kolmogorov-Smirnov test.
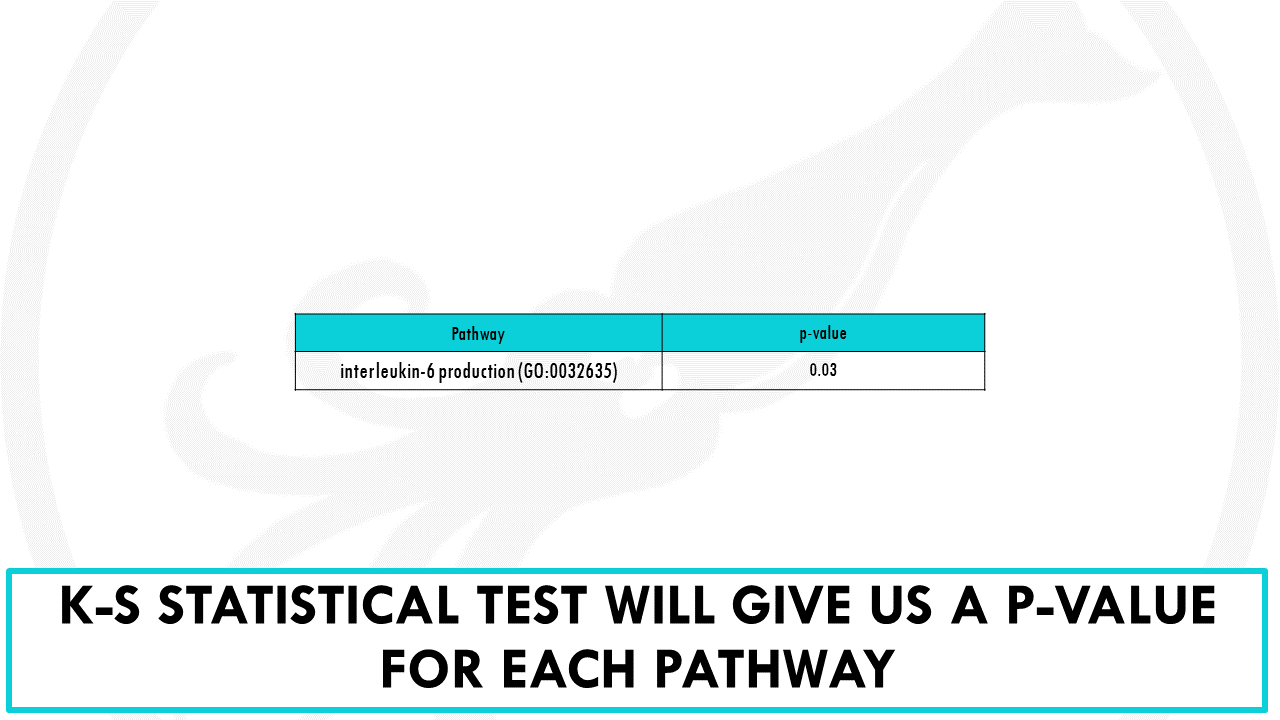
The result is basically the same as with overrepresentation analysis.
We will obtain a p-value, which we need to correct for multiple testing since we are repeatedly testing thousands of gene ontology terms.
This way, we were able to reduce our long list of genes into a more manageable list of biological pathways.
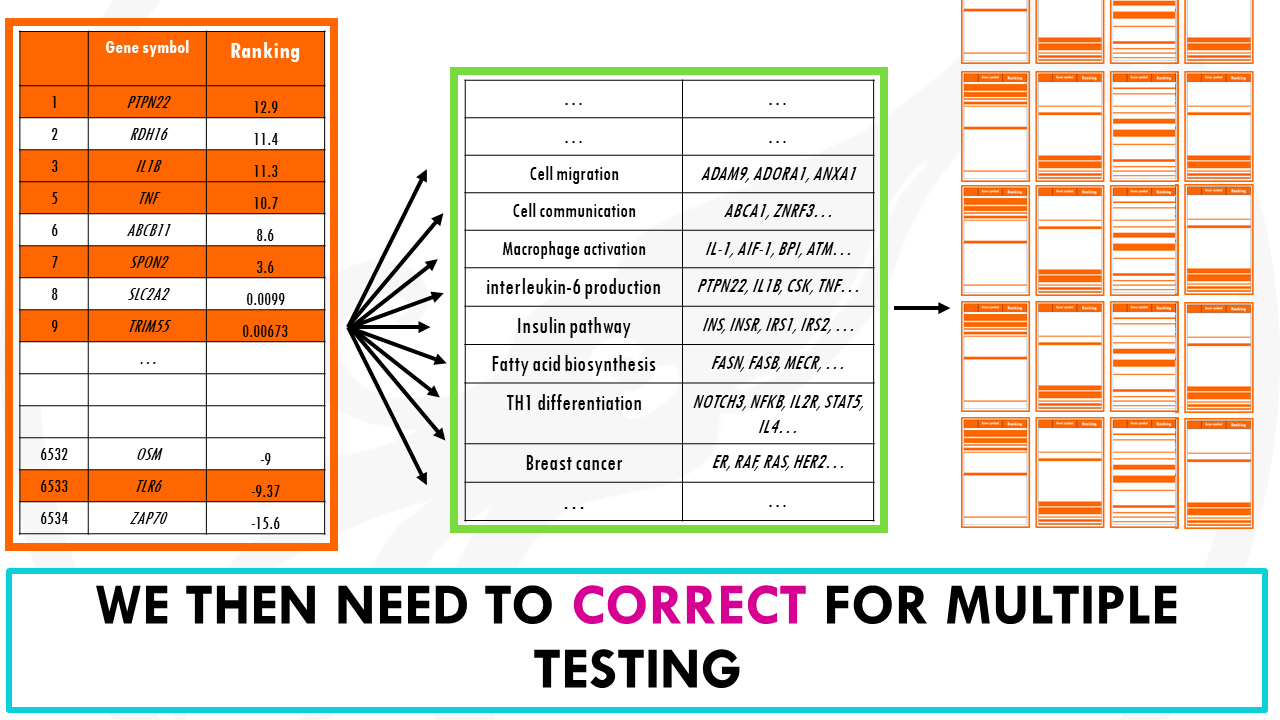
So as you can see, gene set enrichment analysis has the advantage that you don’t filter out genes prior to the analysis, and also it takes into account how significant the changes are, and in which direction.
So, in summary
Gene set enrichment analysis takes your ranked gene list of interest and compares it to a list of background genes. By statistically testing the distribution in your list, it determines which pathways are overrepresented.
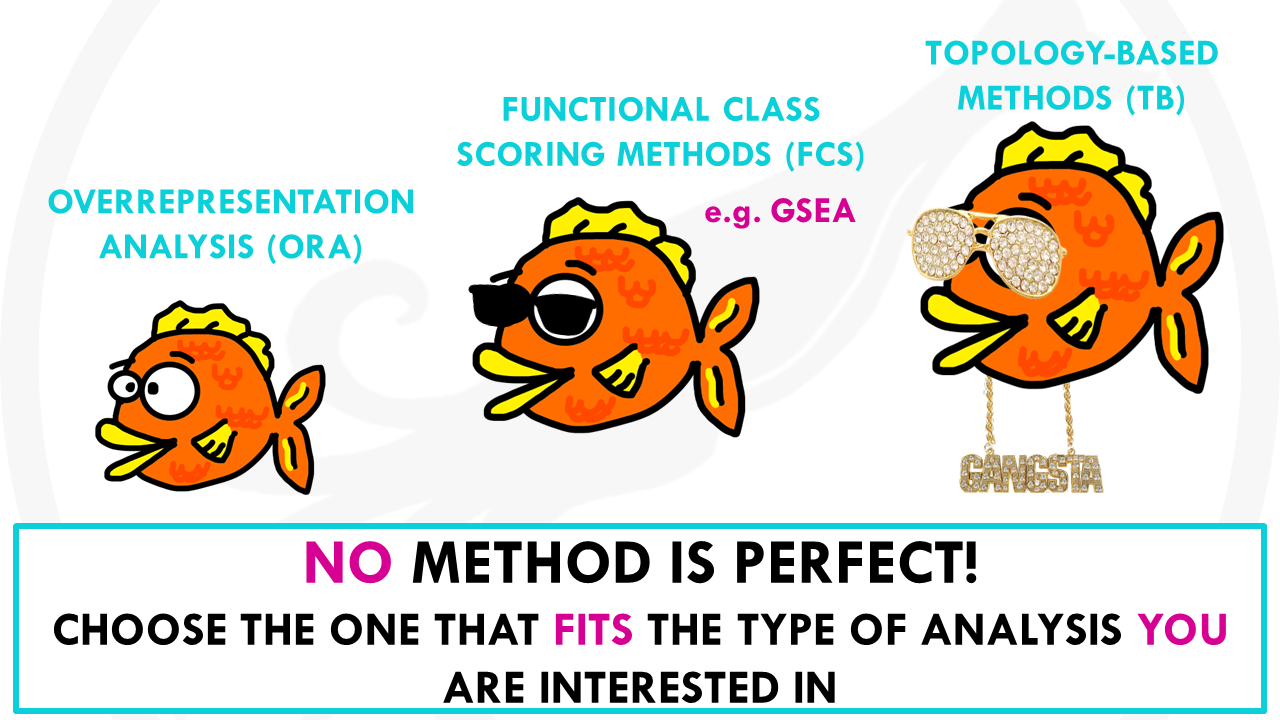
Just to wrap up, there is a new generation of pathway enrichment analysis Topology-based (TB) methods which also take into account dependencies and interactions between genes.
But that is a story for another day.
If you are interested in learning how to interpret GSEA plots and GSEA results, check out my other post!
And that is the end of this tutorial!
In this post, I explained the differences between log2FC and p-value, and why in differential gene expression analysis we don't always get both high log2FC and low p-value. Hope you found it useful!
Before you go, you might want to check:
Squidtastic!
You made it till the end! Hope you found this post useful.
If you have any questions, or if there are any more topics you would like to see here, leave me a comment down below.
Otherwise, have a very nice day and... see you in the next one!


This excellent post introduces the mechanism of GSEA with a clear explanation and vivid cartoon. L love it.
This is the best and clear explaination of GSEA that I ever seen. Thank you so much!. But one question: could you include how to correct false pathways?
Thanks for your comment! Some things you can do to correct false pathways in GSEA are:
– use a more stringent statistical threshold (FDR < 0.05 or q-value < 0.05). - adjust gene set size parameters to avoid inclusion of irrelevant or underpowered gene sets (minGSSize: 5-10, maxGSSize: 100-200). - increase the number of permutations... Hope this helps!
Coming from a non biological background, I am still struggling about the need of background genes.
Since we already have gene list we consider and the databases such as GO and KEGG to look for pathways.
Then why we still need background genes ? This is really confusing to me
Yes, I understand how it can be confusing! Let me see if I can explain it differently.
The background gene list defines the universe of possible genes from which your “significant” genes were selected. It ensures that the enrichment calculation is statistically valid and biologically meaningful.
Suppose you’re checking if a particular gene set (e.g., immune genes) is overrepresented in your differentially expressed genes. To do this, you compare:
1. How many of the DE genes are in the immune set?
2. How many immune genes are there in the total set of genes you could have found?
Without the background set, you don’t know #2 accurately.
For example: You tested 15000 genes in your RNA-seq experiment. You found 300 differentially expressed genes. Of those 300, 40 are immune genes.
If there are 1000 immune genes in the background of 15000, that’s a different result than if there are 1000 immune genes in a universe of only 3000 (imagine that your experiment didn’t go that well and you didn’t capture a lot of lowly expressed genes, so the 40 genes could have only come from those 3000). Your GO immune pathway might have 50 genes of which 40 were DGE. But it’s different thing if the other 10 were not DGE, or if they were simply not there because your experiment didn’t detect them for whatever reason, so you don’t know if they are DEGs or not, they just simply were not detected. So basically, the background affects the expected probability of overlap and it avoids misleading, or incorrect enrichment results.
Hope this helped!
PS. I need to update my R tutorials since now most tools (fgsea for sure) handle this without you needing to worry about it! But it’s good to understand what’s happening:)