
Exploring alpha diversity indices and how to interpret them: Shannon, Simpson, Gini, Chao1 and more!
Whether you are analyzing a rainforest ecosystem, a human gut microbiome, or a B-cell receptor (BCR) repertoire, the fundamental challenge is the same:
How do we accurately measure the diversity within a single population?
Simply counting the number of unique species or clones rarely provides the full picture. To understand the true structure of these communities, we must account for the relative abundance and distribution of every member. This is where alpha diversity comes in. It provides a standardized mathematical framework that allows researchers across different disciplines to quantify complexity, compare samples, and track how biological communities shift over time.
In the following blogpost series, we’ll cover measurements of diversity, including alpha and beta diversity, different diversity indices, richness and evenness. These are key concepts used to describe the composition of a population, from ecology to immunology.
So if you are ready… let’s dive in!
Keep reading or click on the video to learn about alpha diversity metrics, including the Shannon, Simpson, Gini, Chao1 indices and more!
An intuitive explanation of diversity
Let’s start with a few key definitions. We have a community, made up of individuals, which can be classified into types or species. When I say “community” and “species”, I can be referring to classical ecology terms, for example, a community can be a lake, or a forest or a particular region, and type would be the different plants or different animals living in that community. But we could also measure the diversity of people from different nationalities in a city, or the B-cell repertoire of different patients.

I this example, it’s easy to see that community B is more diverse because it has more variety, a higher number of species.

But what about this example? Both communities have the same number of species, but the “feel” is very different right? We could say community A is more diverse because it has a more even distribution of its species or types.

That’s exactly what diversity is all about.
Diversity is a broader concept that combines two ideas: Richness (number of types or species) and Evenness (the relative abundance of those types). A community with evenness of 1 would mean that all its species are present in the same proportion, or equal numbers.
A highly diverse system has many different types (high richness) that are all roughly equal in number (high evenness). Together they describe how complex a community is.

Squidtip
“Richness = count of types”
“Evenness = relative abundance”
If we consider the B cell repertoire of a patient as an example, a “healthy” naive repertoire is usually highly diverse. However, during an infection or vaccination, a few specific B-cells expand to fight the pathogen. This causes clonal expansion, which decreases diversity because a few types now dominate the population (low evenness), even if the total richness remains somewhat high.
How can we measure and compare diversity?
Diversity metrics aim to describe how balanced is the system.
We start by distinguishing alpha and beta diversity.
Alpha diversity metrics just explain diversity within one sample — how many and how balanced the types are.
Beta diversity compares samples — how composition changes across space, time or treatments.
Squidtip
Alpha diversity (α) = within‑sample (local) species diversity — i.e., how many species a site contains and how evenly individuals are distributed among them.
Beta diversity (β) = between‑sample (between‑site) compositional difference (species turnover or dissimilarity) — i.e., how community composition changes across sites or along gradients.
Alpha diversity metrics
Let’s talk about alpha diversity first.
As we mentioned, here we’re looking at a single community. We measure the diversity of each community individually, and we can then compare the alpha diversity indices to decide which one is more diverse. As I mentioned, there’s different ways we can measure the diversity of a community.

We’ll now cover some of the most common alpha diversity indices.
Richness
Richness is the simplest measure of diversity. It tells you the total number of unique categories present in your sample, without considering how many individuals belong to each category. So simply the observed number of types.
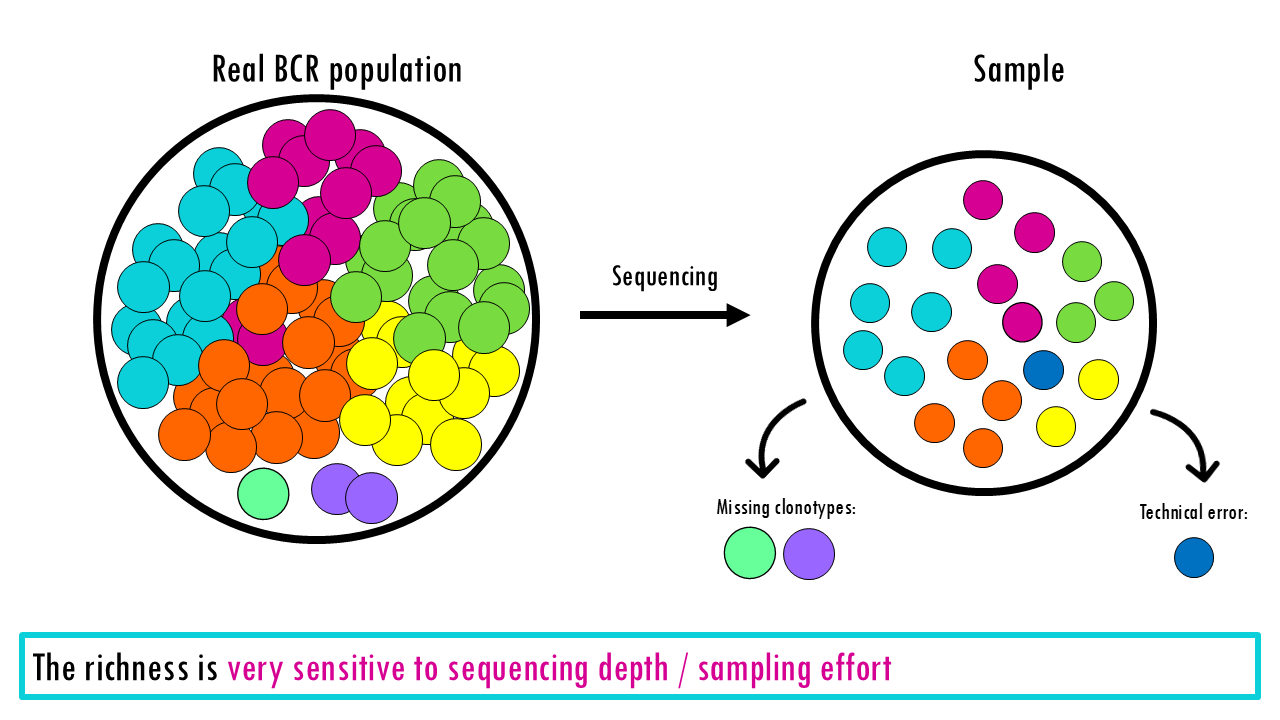
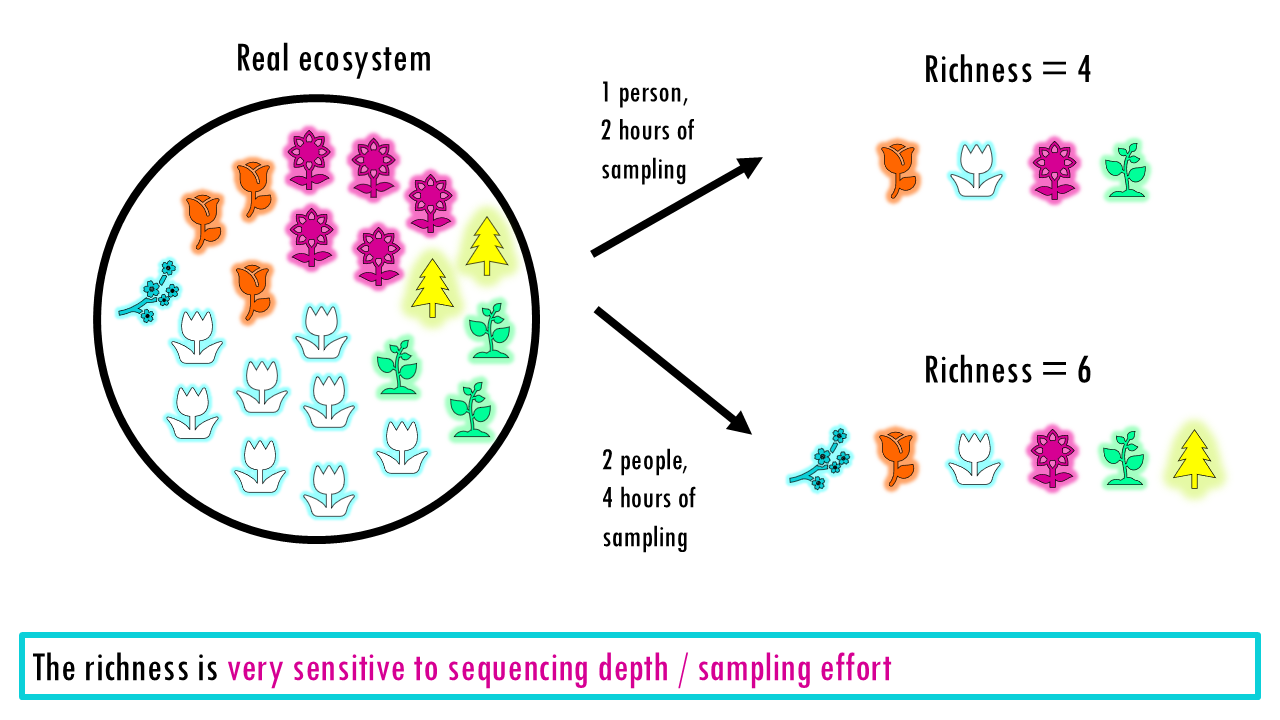
Richness treats every species, or type equally, whether it appears once or 10,000 times. So that is one of it’s main limitations: It doesn’t tell you if the population is balanced. A forest with 100 oaks and 1 maple has the same richness as a forest with 50 oaks and 51 maples, but they “feel” very different. It can also be very sensitive to sequencing depth and technical noise (errors appearing as rare “new” clones), or in the case of ecological studies, how well you did your sampling.

Squidtip
The richness is very sensitive to sequencing depth and technical noise (errors appearing as rare “new” clones), or in the case of ecological studies, how well you did your sampling.
Shannon index
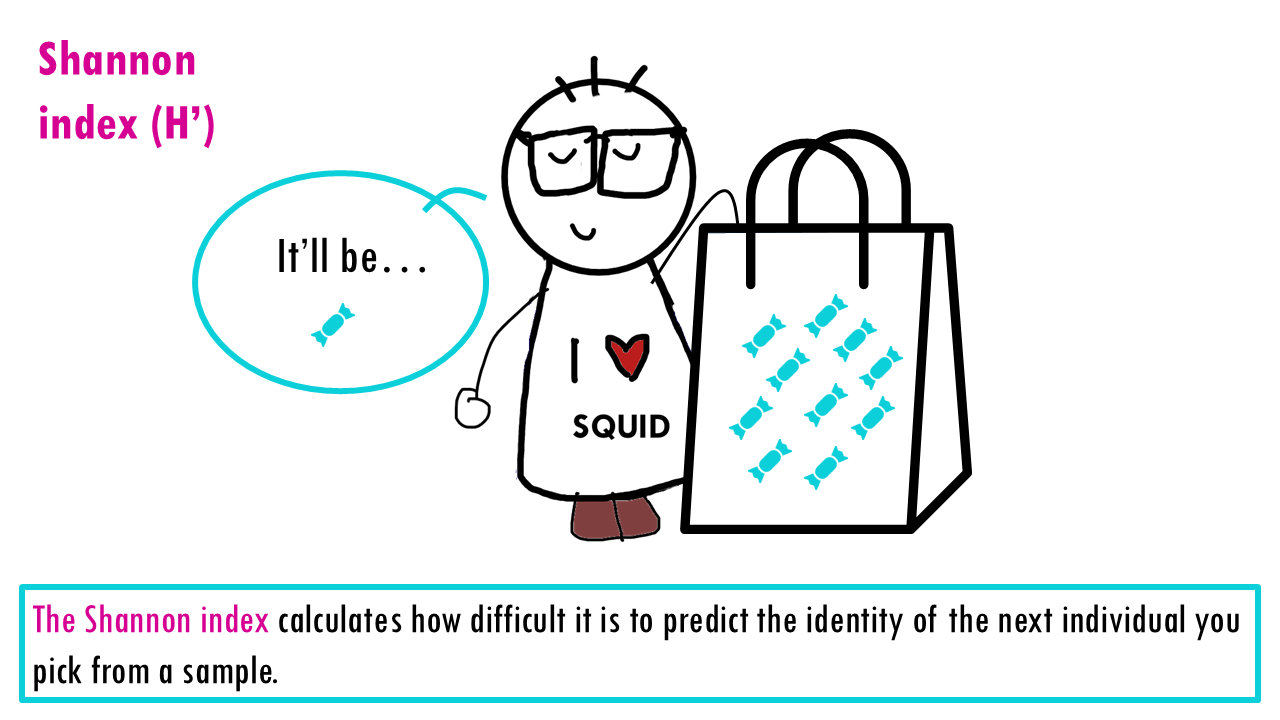
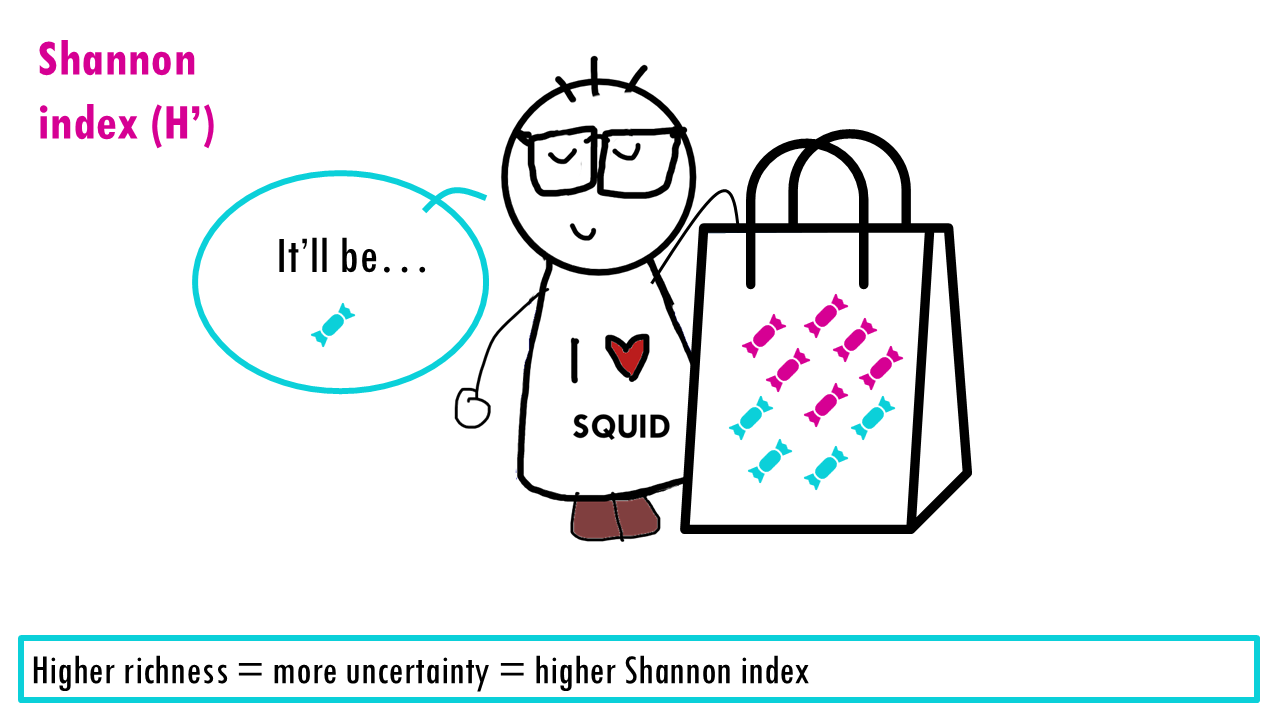
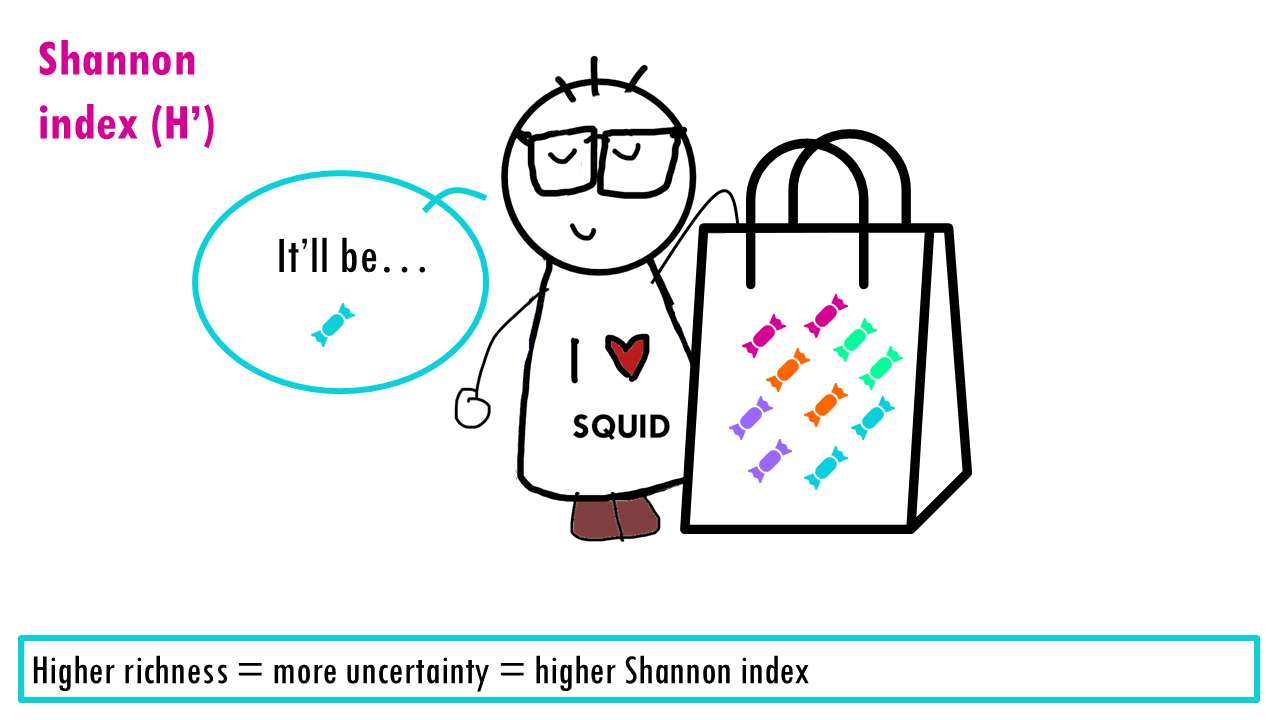
The Shannon index is an information‑theory measure that increases with richness and evenness. It calculates how difficult it is to predict the identity of the next individual you pick from a sample.
Let’s imagine our community is a bag of sweets. You can click the arrows of the slider below to follow how the Shannon index changes with evenness and richness!
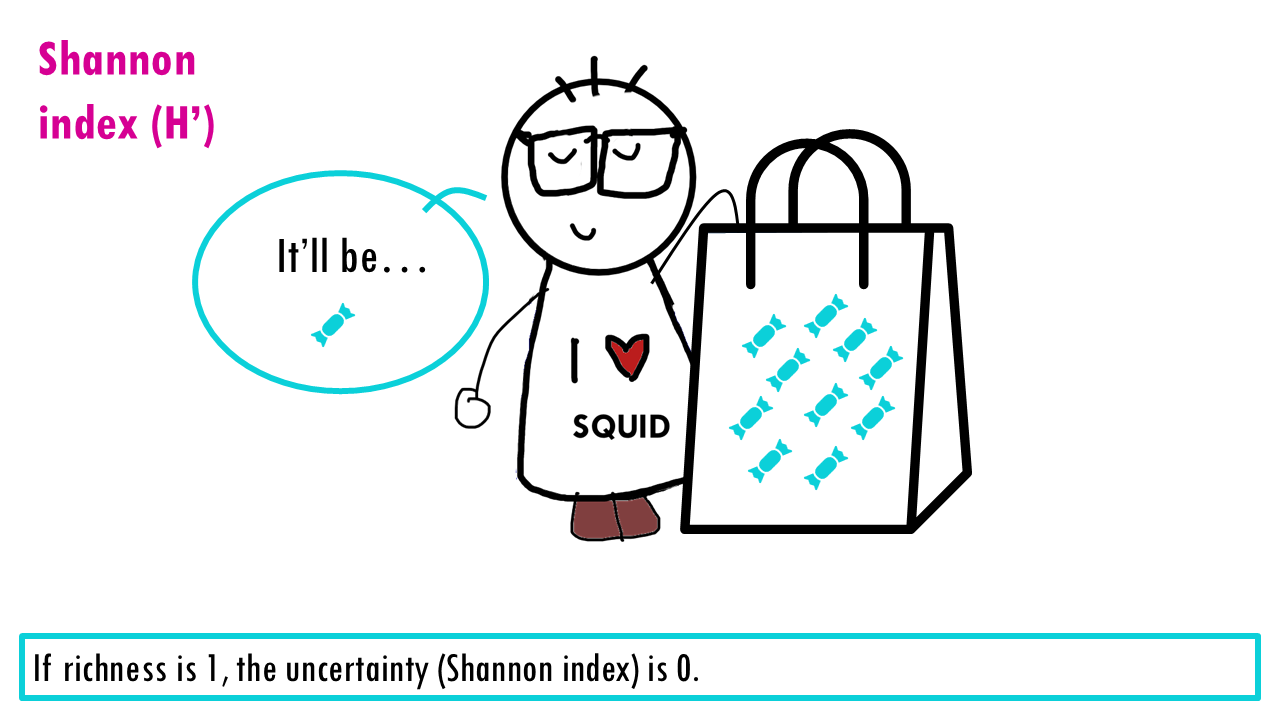
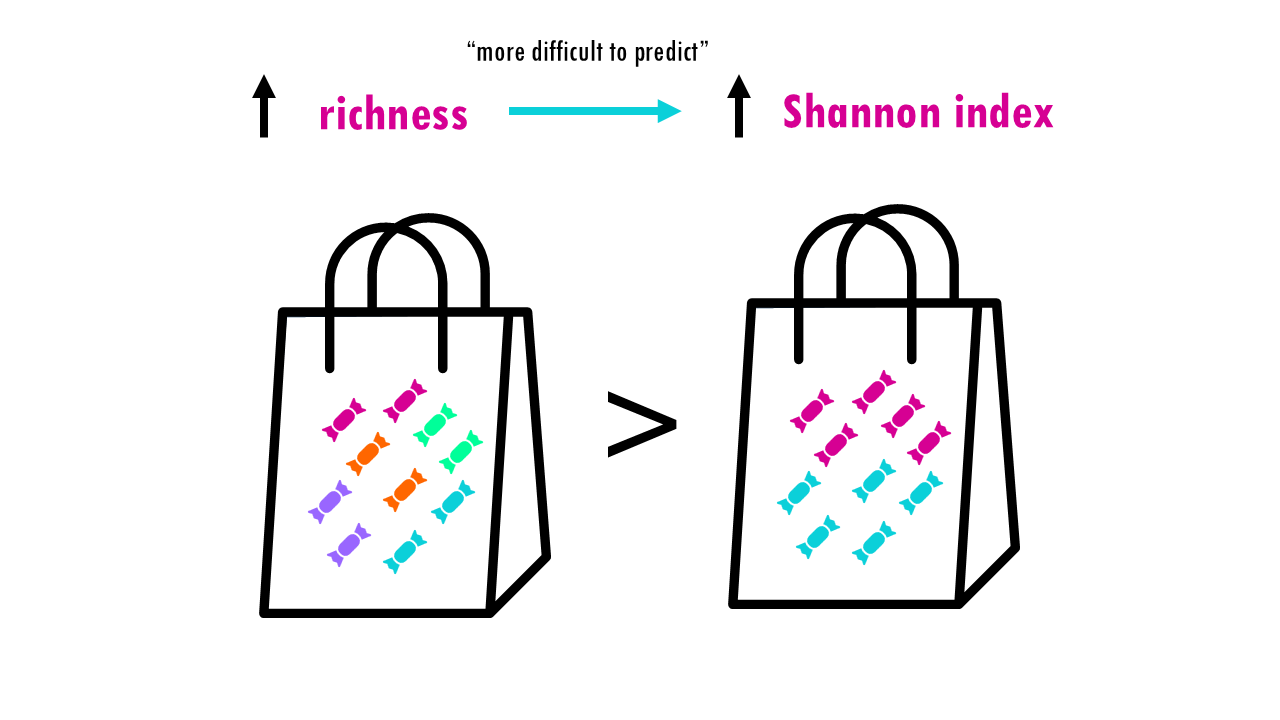
If our community is a bag of sweets, intuitively, the more different colours of sweets there are, the harder it is to predict what you’ll pick out from a bag of sweets. If all sweets are blue, so richness is 1, the uncertainty is zero since we are sure that the randomly chosen sweet will belong to that one only species. If there’s more different colour sweets (more species), we are unlikely to guess which species will be the randomly chosen individual (or sweet). The higher the richness, the higher the uncertainty; so the higher the Shannon index is.
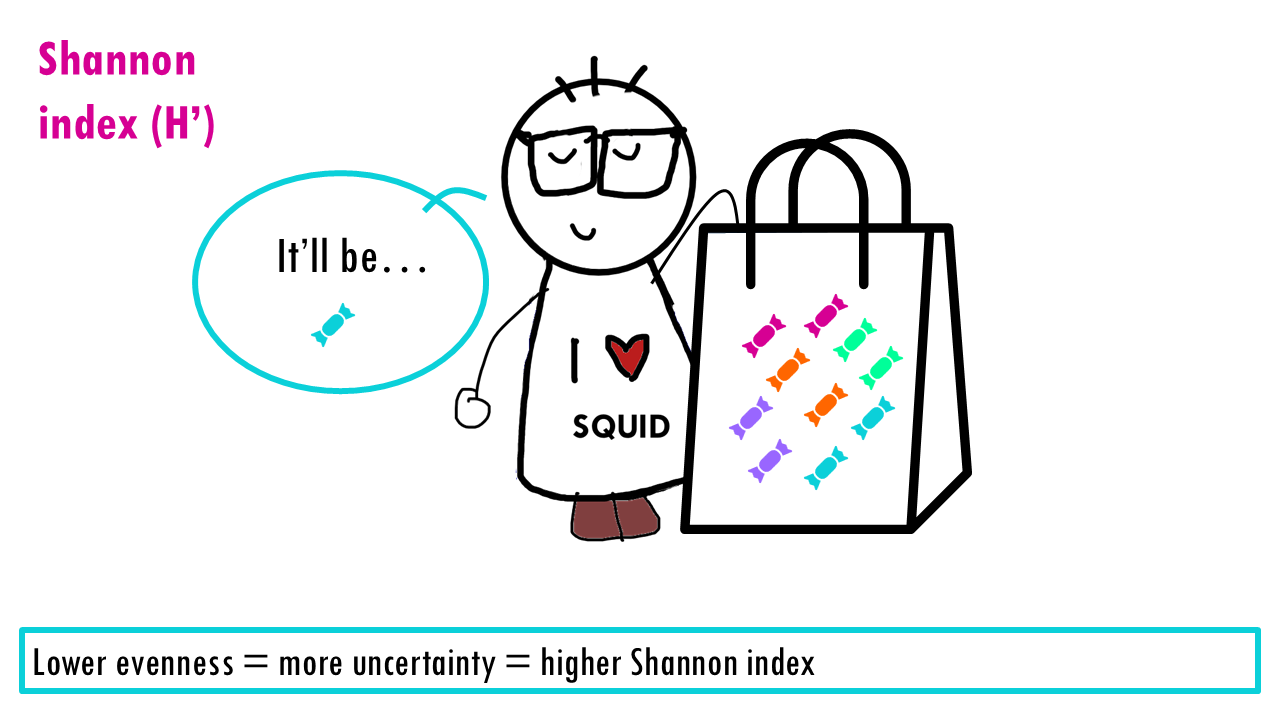
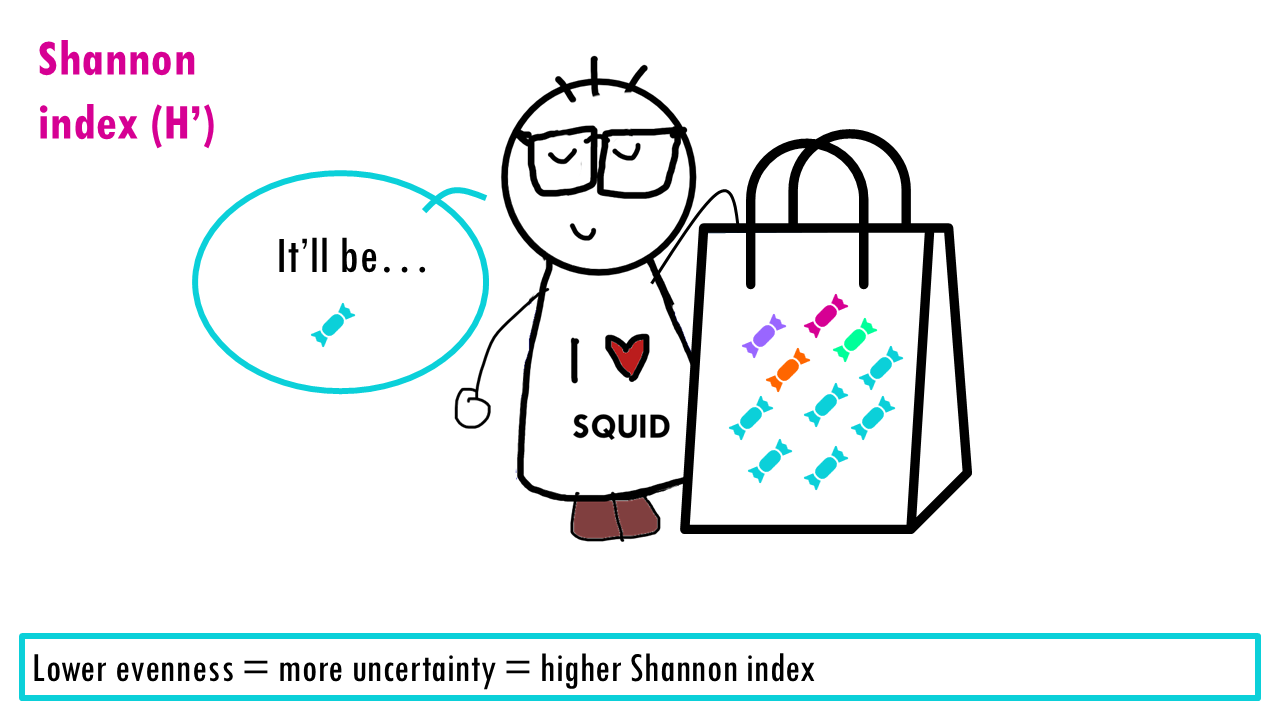
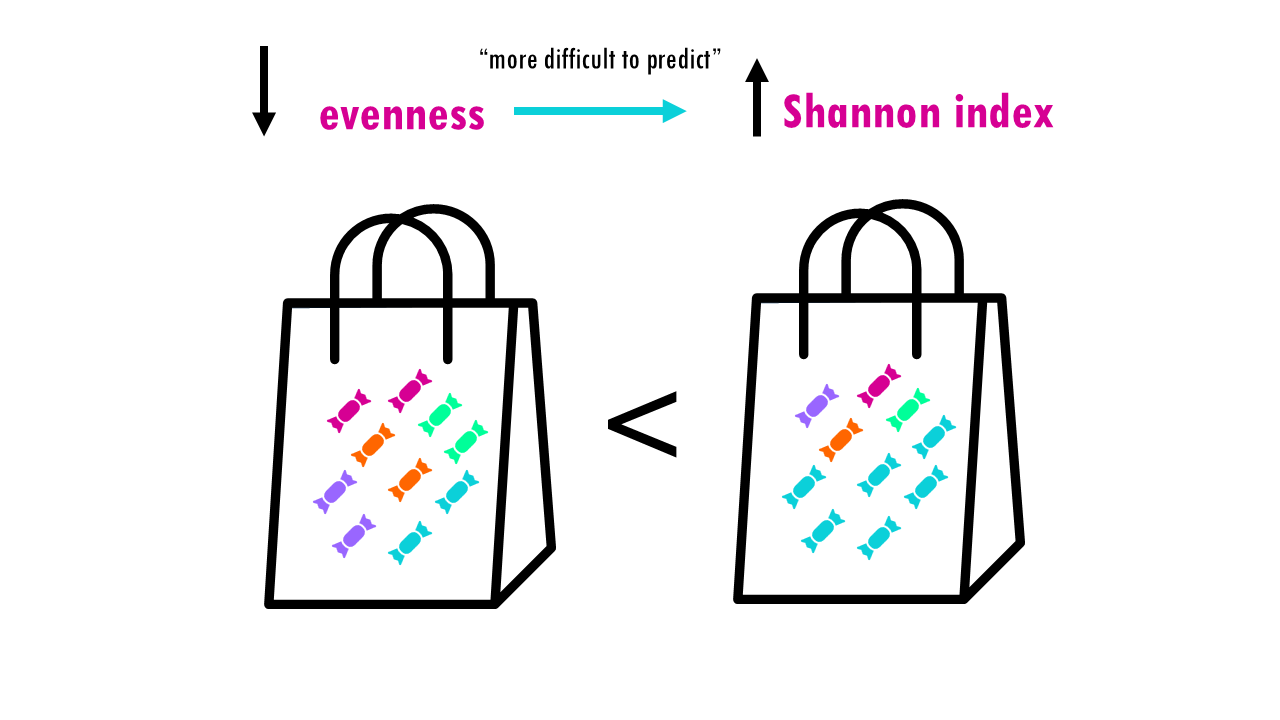
But the Shannon index also depends on the evenness. So if we have the same richness, 4 different species or colours, it’ll be easier to predict if the distribution of abundances is more uneven. Imagine only the blue sweet is very common, then the uncertainty will not be so high since we have a high probability that the randomly selected individual or sweet will be the most abundant species.
This is why the Shannon index increases with richness and evenness, and it puts more weight on richness than on evenness.
To explain these relationships in a bit more detail, I’ll use these figures from David Zeleny’s blogpost which I highly recommend you check out. We have 3 communities with 12 species, represented by colours, but the proportions are different. Community A is perfectly even, meaning all species are present in the same proportion. Community B is moderately uneven, meaning certain species like the red and the mauve are more abundant in the population than others. And community C is highly uneven, which we could interpret as a particular BCR clone being very expanded and taking over the immune response, for example.

All 3 communities have a richness of 12. As you can see from this plot, no matter the uneveness, all communities have a richness of 12. What about the Shannon index? As you can see, for a specific richness or number of species (in this case, 12), the Shannon entropy decreases exponentially the more uneven the community is. So community A has a Shannon entropy, or uncertainty of 2.5 and for community C it is 0.87. Seen in a different way, let’s focus on unevenness of 0, meaning all species have the same proportion, they are all equally distributed, like community A. The higher the number of species, the higher the Shannon index but the relationship is not linear.

In conclusion, the Shannon index (H’) gives us an idea of diversity and depends on both evenness and richness, so a community with:
- High H’: means it has high diversity (lots of types, evenly spread).
- Low H’: means it has low diversity (one or two types dominate),
Simpson index
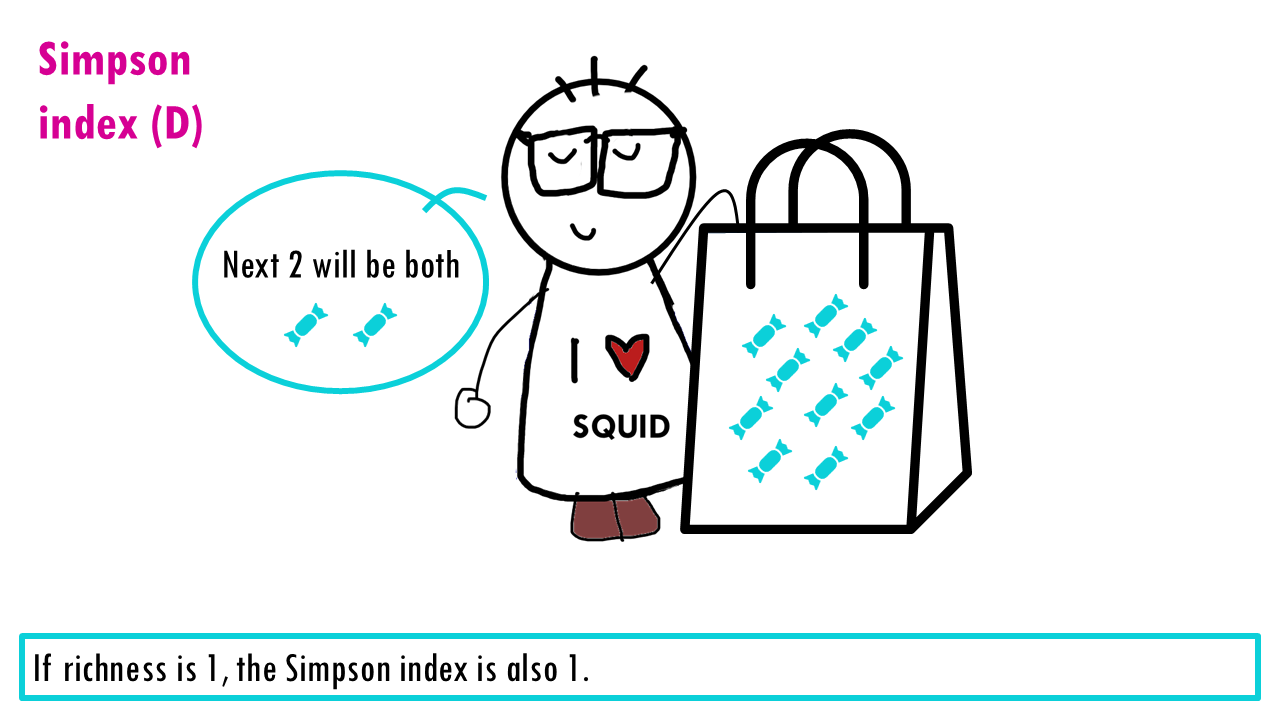
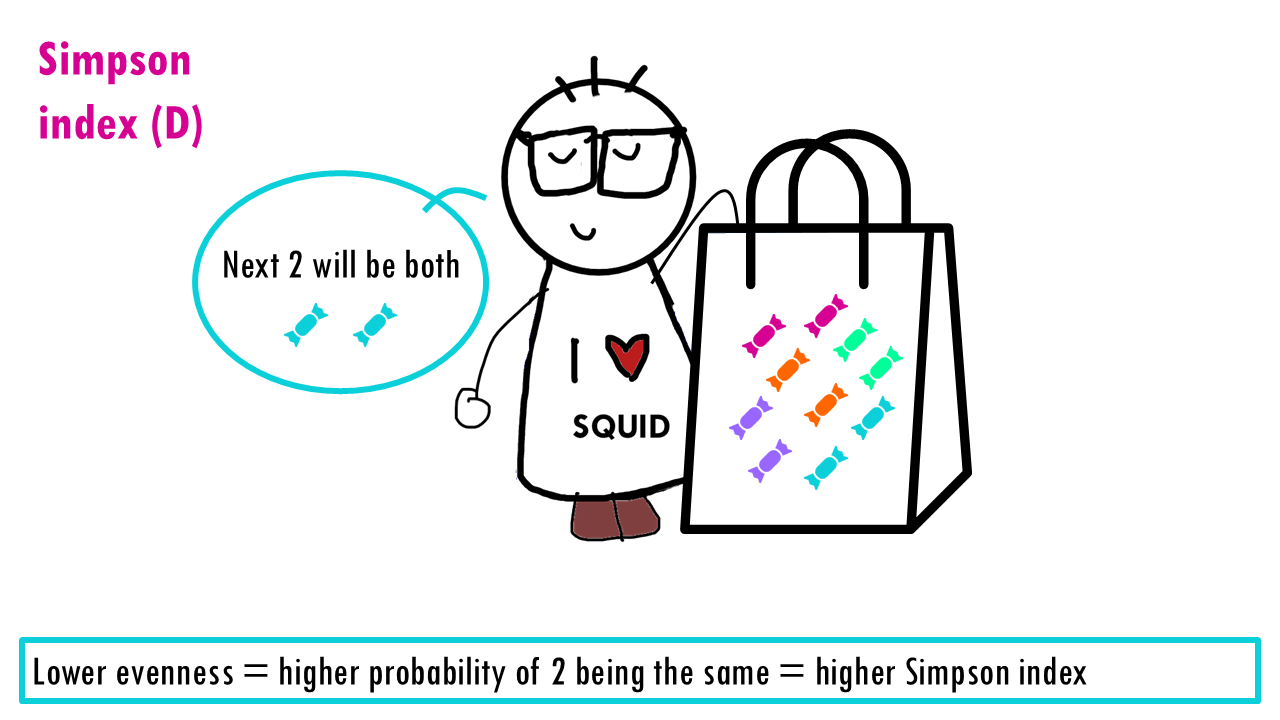
The measures the probability that two individuals randomly picked from a sample will be the same type or species. In other words, it measures dominance, whether a particular species dominates. Since we’re talking about probabilities, the Simpson index goes from 0 to 1, with higher being less diverse. Think about it: if all sweets are the same, then the probability that the two sweets will be the same is 1.
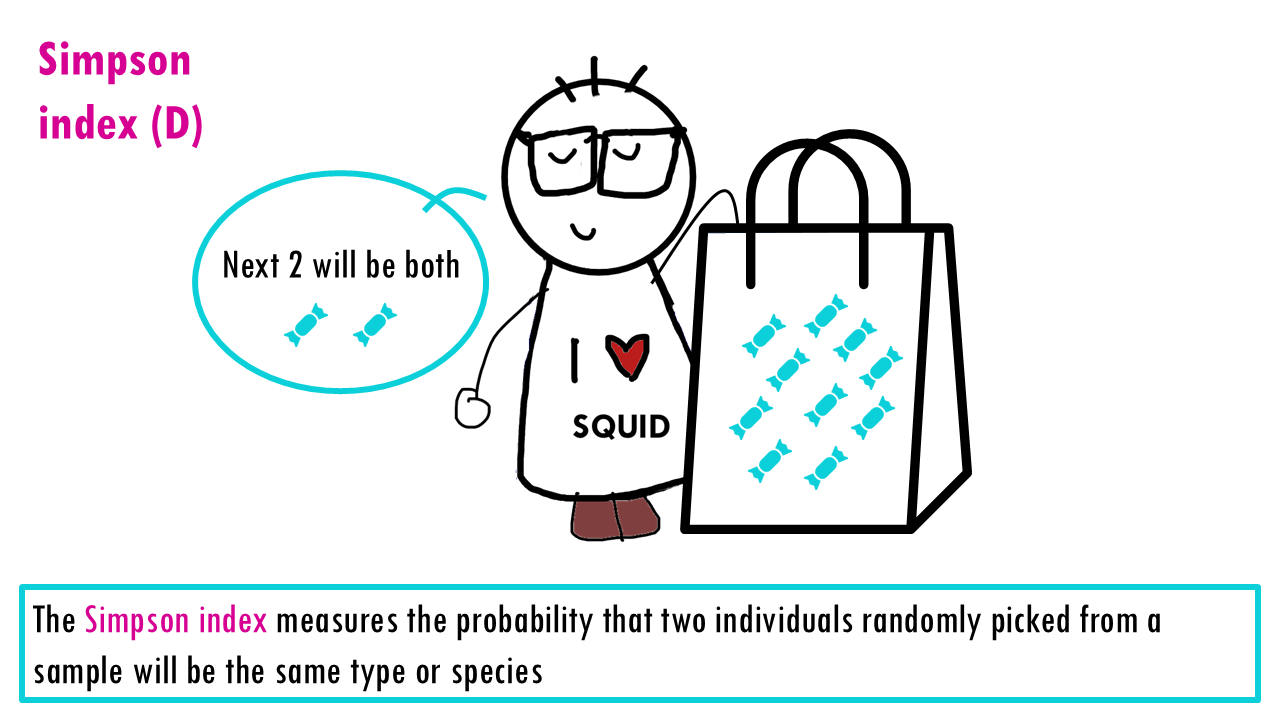
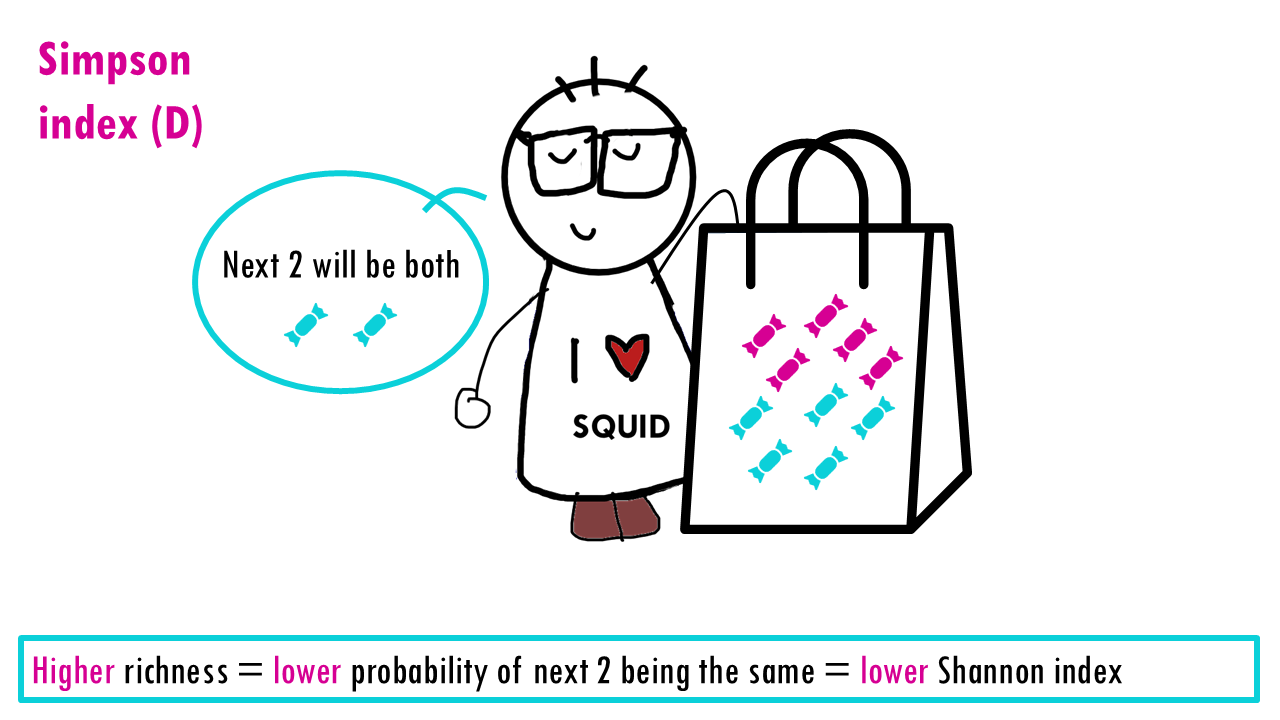
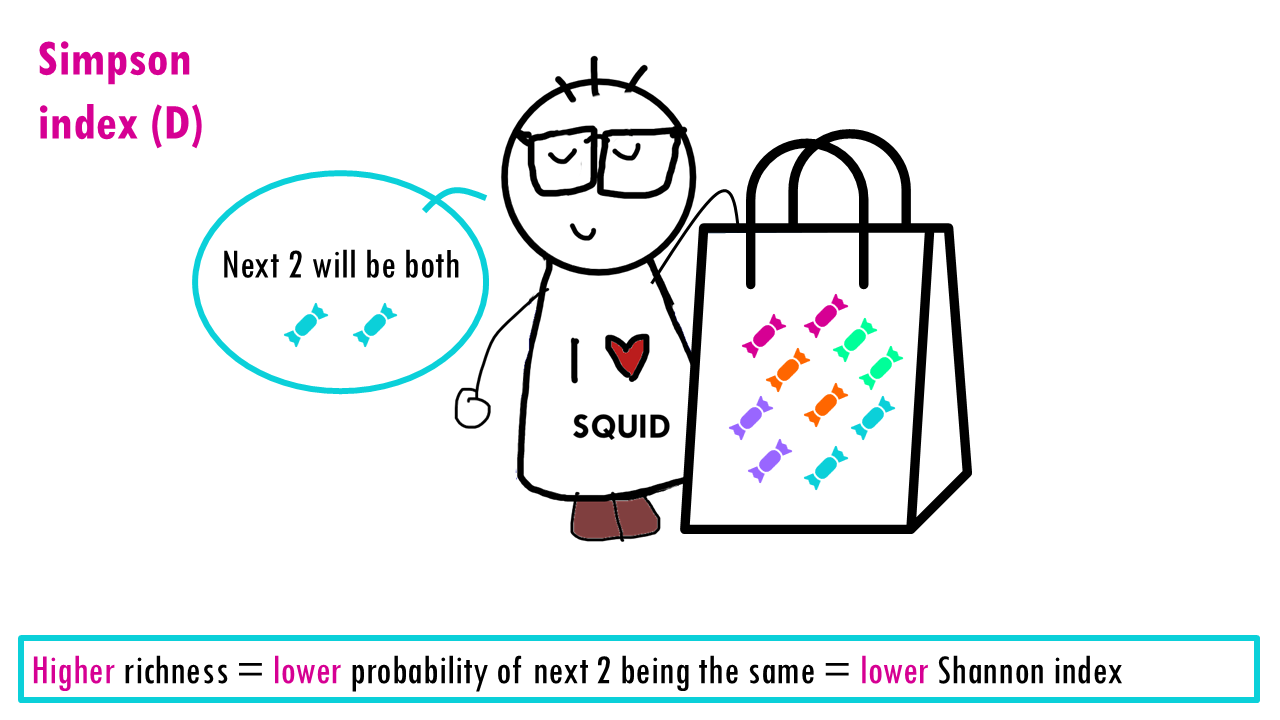
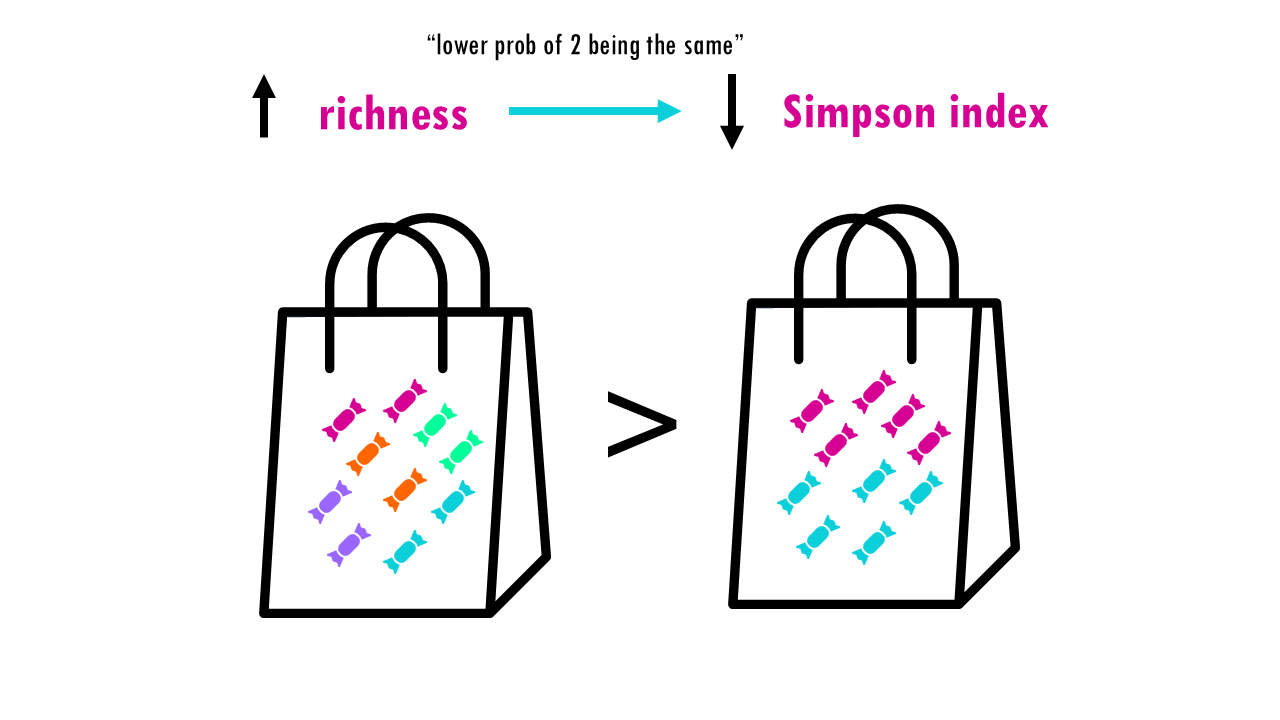
Let’s see what happens when the richness increases and we have perfect evenness. The more richness, so more colours, the less probable it is that Sid will take out 2 of the same colour. So higher richness, lower Simpson index.
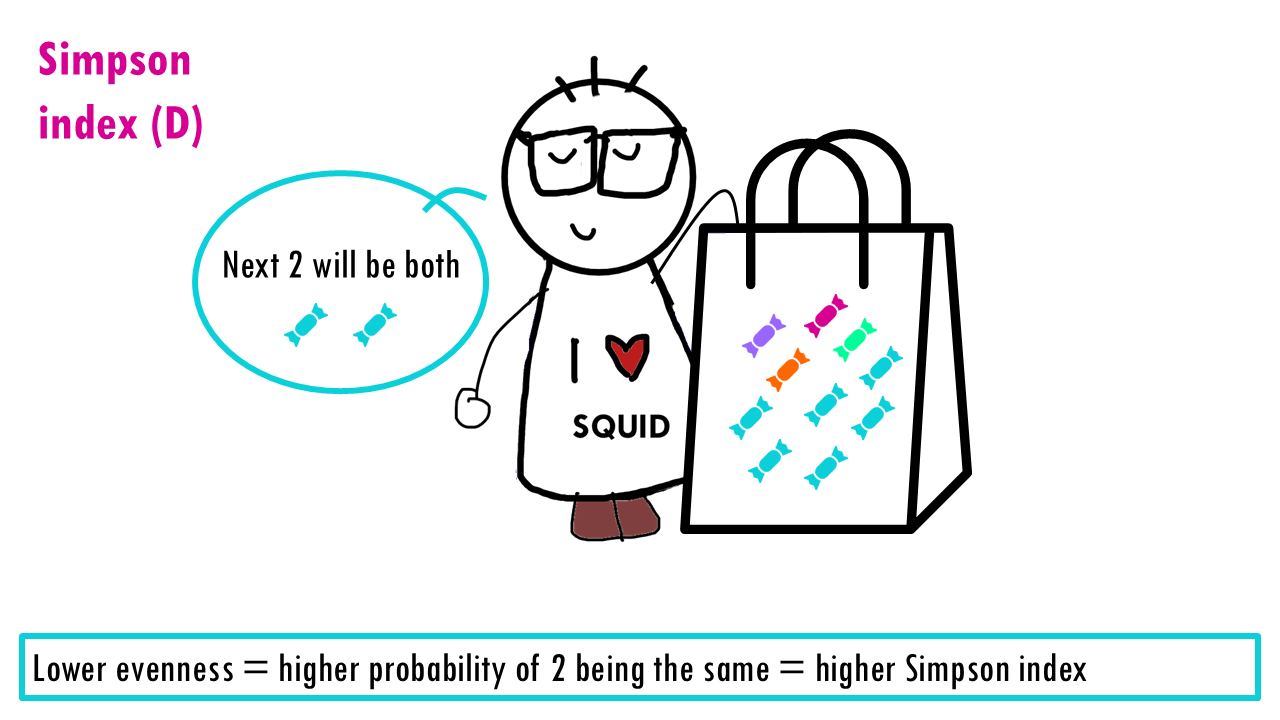
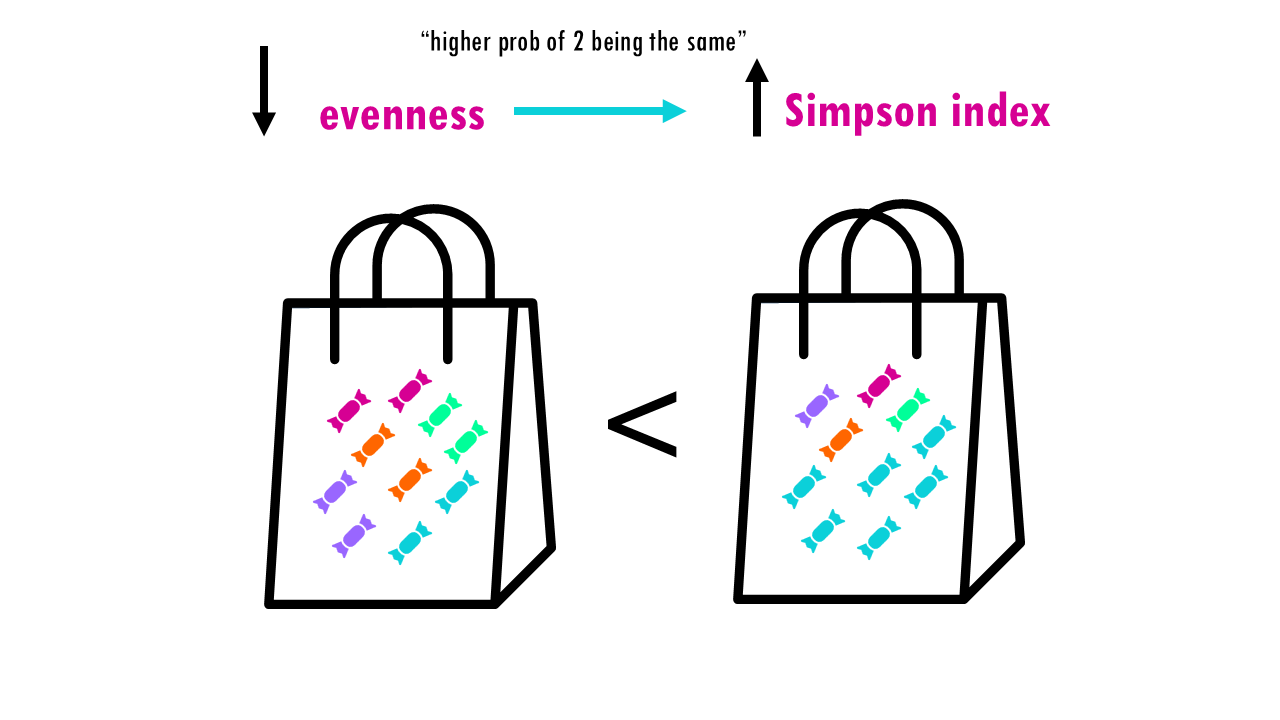
Now let’s consider evenness. The lower the evenness – so if 1 sweet “dominates” – then the higher the Simpson index is.
This is a bit counterintuitive for a diversity metric, right? It’s easier to think of a diversity metric as higher meaning more diversity, but with the Simson index it’s the opposite: a higher Simson index means one species dominates, so you have lower diversity.
This is why we often report the Gini-Simpson index which is simple 1 – Simpson index. So now 0 = less diverse and 1 = more diverse.

Sometimes you’ll also see Simson’s reciprocal index or inverse Simson which is 1 divided by the Simson index. This just ensures that we can interpret it as the higher the value, the more diversity.

Ok, so like the Shannon index, the Simpson index considers both richness and evenness, but compared to Shannon, it is more influenced by evenness than richness. If we go back to our example, we have 3 communities with the same richness. Let’s have a look at the effect of evenness on the Gini-Simson index. You can see that the less even the community is, so Community C, the lower the Gini-Simpson index (so lower diversity).

What about the effect of richness? For that we’ll consider perfectly even communities with different number of species. In black we see the Shannon index values, which we already covered. In red we see the Gini Simpson index values which follow the scale on the right. As you can see, the Gini-Simson index values – the red dashed line- quickly increase for the first 10 species or so, but with higher numbers it doesn’t change much. So the difference in the Gini-Simpson index between a community of 40 or 80 species with the same evenness is really small, whereas the Shannon index changes quite a bit.

In conclusion, the Simpson index is more sensitive to “abundant” types than the Shannon index.
Chao1
Chao1 is a richness estimator. As we mentioned, richness is very sensitive to the sampling effort. Because we can never sequence every single B-cell or find every rare insect in a forest, Chao1 uses the number of “singletons” (types seen only once) to estimate how many unseen types are likely missing from our data. This is especially useful for BCR data as it can help estimate the true size of an individual’s total immune repertoire from a small blood draw.

Choosing a diversity metric
So which metric should we use to measure diversity in our dataset?
The answer, as usual, is it depends. For example, if you’re interested in comparing the immune response between two samples, we can do it in several ways.
- The richness will count every single clonotype in the samples, even those that only appear once, and as we mentioned, it is more sensitive to sequencing errors and sampling.
- If we want to focus on the more expanded or dominant clones, so we want to give evenness more importance than richness, then we would use the Simpson index.
- And if we want some sort of balance between evenness and richness, we would go with the Shannon index.

Diversity or entropy?
Now, I’ve actually being lying from the start. Up until now, we haven’t really been talking about diversity, we’ve been talking about entropy. This idea was introduced by Lou Jost in 2006, and it revolutionized how we think about diversity. He argued that most standard indices (like Shannon or Simpson) are entropies, not diversities, and that this distinction is crucial for making accurate biological comparisons.
So what is entropy? And why is it not a good way of measuring diversity in our data?
Hill Numbers:
One Metric to Rule Them All?
Find out more in this blogpost: Hill numbers to measure diversity!
Final notes
Squidtastic!
In this blogpost we covered some of the most popular diversity statistics like Shannon, Simpson, Gini and Chao1 indices. They each have their strengths and limitations, and depending on how we want to define diversity in our dataset, we can use one metric or another to compare communities.
Want to know more?
Additional resources
If you would like to know more about single-cell integration methods, check out:
- Roswell et al., “A conceptual guide to measuring species diversity” — Hill numbers & coverage (practical guidance).
- Barwell, Isaac & Kunin (2015), “Measuring β‑diversity with abundance data” — evaluation and properties of β metrics.
- Jost L., “Entropy and diversity” (Oikos, 2006) — why convert entropies to effective numbers; Hill numbers & replication property.
- Carpentries / metagenomics alpha–beta R tutorial — short instructional material and plotting examples.
You might be interested in…
Squidtastic!
Wohoo! You made it 'til the end!
Hope you found this post useful. If you have any questions, or if there are any more topics you would like to see here, leave me a comment down below. Your feedback is really appreciated and it helps me create more useful content:)
Otherwise, have a very nice day and... see you in the next one!
Before you go, you might want to check:
Squids don't care much for coffee,
but Laura loves a hot cup in the morning!

If you like my content, you might consider buying me a coffee.
You can also leave a comment or a 'like' in my posts or Youtube channel, knowing that they're helpful really motivates me to keep going:)
Cheers and have a 'squidtastic' day!
